Matplotlib에서 pyplot.figure() 사용
Suraj Joshi
2024년2월15일
Matplotlib
Matplotlib Figure

이 튜토리얼에서는matplotlib.pyplot.figure()를 사용하여 Matplotlib Figure의 다양한 속성을 변경하는 방법을 설명합니다. matplotlib Figure는 플롯의 모든 축과 속성을 담은 최상위 컨테이너입니다. Matplotlib 그림에 대한 자세한 내용은 공식 문서 페이지를 참조하세요.
matplotlib.pyplot.figure()를 사용하여 Figure 속성 설정
matplotlib.pyplot.figure(num=None,
                         figsize=None,
                         dpi=None,
                         facecolor=None,
                         edgecolor=None,
                         frameon=True,
                         FigureClass= < class 'matplotlib.figure.Figure' > ,
                         clear=False,
                         **kwargs)
matplotlib.pyplot.figure()를 사용하여 새 그림을 만들고 다양한 매개 변수의 값을 설정하여figsize,dpi 등과 같은 플롯을 사용자 정의 할 수 있습니다.
예 :matplotlib.pyplot.figure()를 사용하여 Figure 속성 설정
import matplotlib.pyplot as plt

x = [1, 2, 3, 4, 5, 6]
y = [4, 3, 5, 6, 7, 4]

plt.figure(figsize=(8, 6), facecolor="yellow")

plt.plot(x, y)
plt.xlabel("X")
plt.ylabel("Y")
plt.title("Plot with figsize (8,6)")
plt.show()
출력:
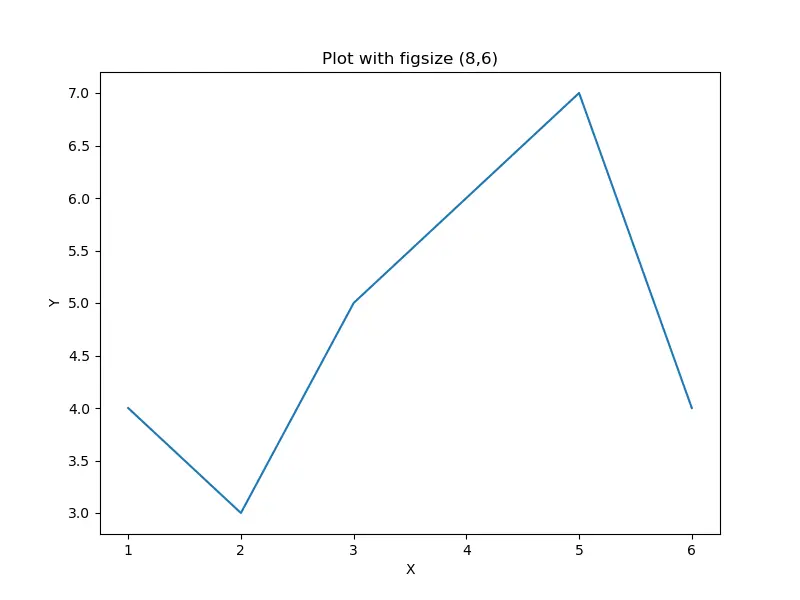
Figure 개체를 만들고 Figure의 너비를 8 인치로, Figure의 높이를 6 인치로 설정합니다. 얼굴색은 노란색으로 설정되어 있습니다.
matplotlib.pyplot.figure()를 사용하여 그림에 서브 플롯 추가
matplotlib.pyplot.figure()는add_subplot()메소드를 사용하여 Figure에subplots를 추가하는 데 사용할 수있는 Figure 객체를 반환합니다.
import matplotlib.pyplot as plt

x = [1, 2, 3, 4, 5, 6]
y = [4, 3, 5, 6, 7, 4]

fig = plt.figure()

subplot1 = fig.add_subplot(2, 1, 1)
subplot1.plot(x, y)

subplot2 = fig.add_subplot(2, 1, 2)
subplot2.text(0.3, 0.5, "2nd Subplot")

fig.suptitle("Add subplots to a figure")
plt.show()
출력:
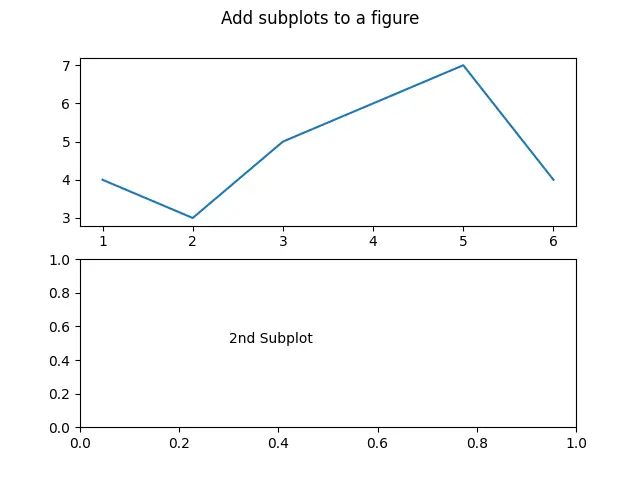
matplotlib.pyplot.figure()메소드를 사용하여 생성 된 Figure 객체fig에 두 개의 서브 플롯을 추가합니다.
튜토리얼이 마음에 드시나요? DelftStack을 구독하세요 YouTube에서 저희가 더 많은 고품질 비디오 가이드를 제작할 수 있도록 지원해주세요. 구독하다
작가: Suraj Joshi

Suraj Joshi is a backend software engineer at Matrice.ai.
LinkedIn