Matplotlib에서 도형 크기 및 형식을 변경하는 방법
-
초기화 중
figure()메소드에서figsize설정 -
Matplotlib에서 그림의 크기를 변경하려면
rcParams를 설정하십시오 -
set_figheight()와set_figwidth()와 함께 Matplotlib 도형 크기 설정 -
Matplotlib 도형 크기를 변경하는
set_size_inches()메소드 - Matplotlib에서 그림 형식 변경

우리는set_figheight()와set_figwidth()및set_size_inches()메소드를 사용하여 Matplotlib에서 figure() 크기를 변경할 수 있습니다. figure()메소드와rcParams에서figsize를 설정하여 Matplotlib에서 도형 크기를 변경할 수도 있습니다. 마찬가지로 그림 형식을 변경하려면savefig()메서드에서 이미지 파일의 확장자를 변경하면됩니다.
초기화 중figure()메소드에서figsize 설정
초기화 동안figure()메소드에서figsize 매개 변수의 값을 설정할 수 있습니다. 이는 그림의 너비와 높이를 인치 단위로 지정합니다.
import numpy as np
import matplotlib.pyplot as plt

x = np.linspace(0, 10, 0.5)
m = 1
c = 2
y = m * x + c

plt.figure(figsize=(6, 4))
plt.plot(x, y)
plt.title("y=mx+c")
plt.xlabel("x-axis")
plt.ylabel("y-axis")

plt.show()
출력:
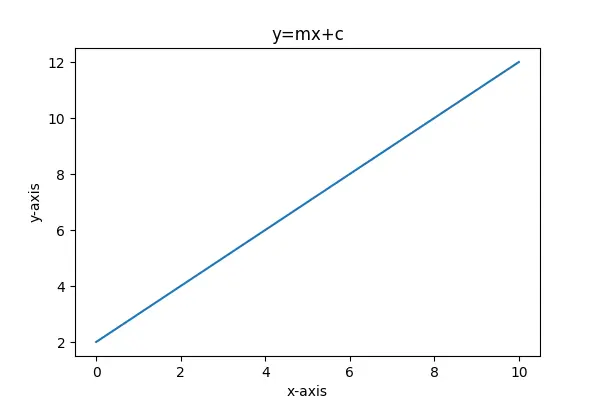
figsize 매개 변수의 기본값은[6.4, 4.8]입니다.
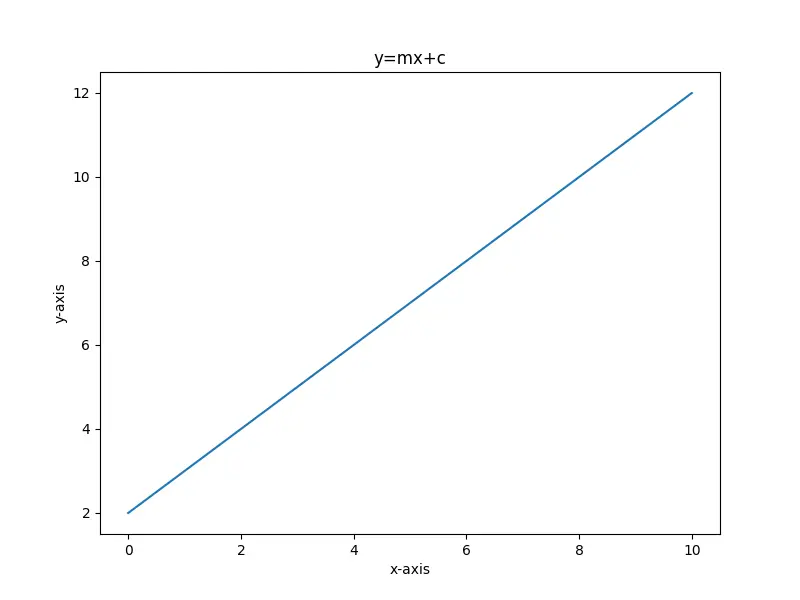
Matplotlib에서 그림의 크기를 변경하려면rcParams를 설정하십시오
Matplotlib에서 Figure 크기를 변경하기 위해matplotlib.rcParams 사전에 저장된 기본figure.figsize 값을 변경할 수 있습니다.
import numpy as np
import matplotlib.pyplot as plt

x = np.linspace(0, 10, 20)
m = 1
c = 2
y = m * x + c

plt.rcParams["figure.figsize"] = (8, 6)
plt.plot(x, y)
plt.title("y=mx+c")
plt.xlabel("x-axis")
plt.ylabel("y-axis")

plt.show()
출력:
set_figheight()와set_figwidth()와 함께 Matplotlib 도형 크기 설정
Figure가 이미 생성 된 경우set_figheight()및set_figwidth()방법을 사용하여 Figure 크기를 지정할 수 있습니다.
import numpy as np
import matplotlib.pyplot as plt

x = np.linspace(0, 10, 20)
m = 1
c = 2
y = m * x + c

fig = plt.figure()
plt.plot(x, y)
plt.title("y=mx+c")
plt.xlabel("x-axis")
plt.ylabel("y-axis")
fig.set_figheight(6)
fig.set_figwidth(8)

plt.show()
출력:
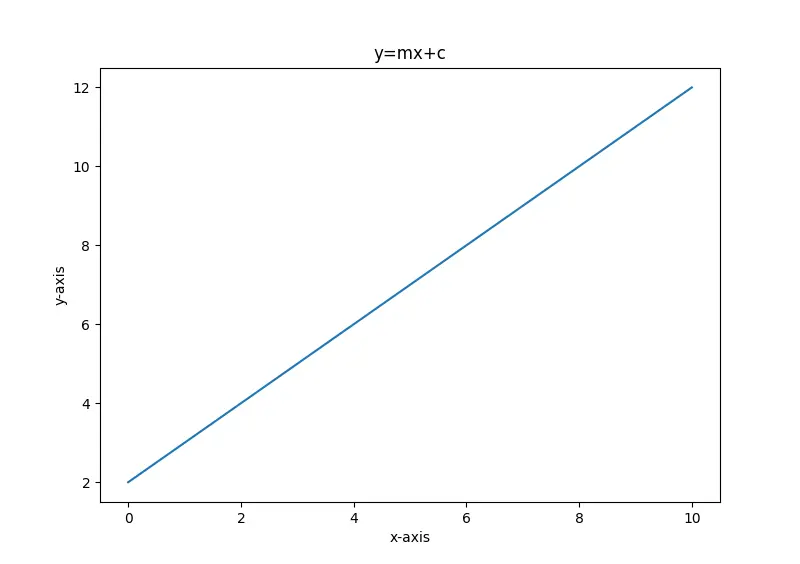
set_figheight()메소드는 Figure의 높이를 설정하고set_figwidth()는 Figure의 너비를 설정합니다.
Matplotlib 도형 크기를 변경하는set_size_inches()메소드
이 방법은 그림이 작성된 후 그림 크기를 설정할 수도 있습니다.
import numpy as np
import matplotlib.pyplot as plt

x = np.linspace(0, 10, 20)
m = 1
c = 2
y = m * x + c

fig = plt.figure()
plt.plot(x, y)
plt.title("y=mx+c")
plt.xlabel("x-axis")
plt.ylabel("y-axis")
fig.set_size_inches(5, 5)

plt.show()
출력:

여기서set_size_inches()메소드에 전달 된 인수는 각각 그림의 너비와 높이를 인치 단위로 나타냅니다.
Matplotlib에서 그림 형식 변경
Figure 형식을 변경하기 위해savefig()메소드에서 이미지 파일의 확장자를 변경할 수 있습니다. png,jpg,svg,pdf 등 다양한 형식으로 플롯을 저장할 수 있습니다.
import numpy as np
import matplotlib.pyplot as plt

x = np.linspace(0, 10, 20)
m = 1
c = 2
y = m * x + c

fig = plt.figure()
plt.plot(x, y)
plt.title("y=mx+c")
plt.xlabel("x-axis")
plt.ylabel("y-axis")
fig.set_size_inches(5, 5)

plt.savefig("Figure saved in jpg format.jpg")
이것은 그림을jpg 형식으로 저장합니다.

Suraj Joshi is a backend software engineer at Matrice.ai.
LinkedIn