如何在 Matplotlib 中更改图形大小及格式
Suraj Joshi
2024年2月15日
Matplotlib
Matplotlib Figure
-
初始化期间在
figure()方法中设置figsize -
设置
rcParams来更改 Matplotlib 中图形的大小 -
set_figheight()和set_figwidth()一起设置 Matplotlib 图形大小 -
set_size_inches()方法来更改 Matplotlib 图形大小 - 在 Matplotlib 中更改图形格式

我们可以使用 set_figheight() 和 set_figwidth() 和 set_size_inches() 方法来更改 Matplotlib 中的图形大小。我们也可以通过在 figure() 方法和 rcParams 中设置 figsize 来改变 Matplotlib 中的图形大小。同样,要更改图形格式,我们只需在 savefig() 方法中更改图像文件的扩展名。
初始化期间在 figure() 方法中设置 figsize
我们可以在初始化期间通过 figure() 方法设置 figsize 参数的值,该参数以英寸为单位指定图形的宽度和高度。
import numpy as np
import matplotlib.pyplot as plt

x = np.linspace(0, 10, 0.5)
m = 1
c = 2
y = m * x + c

plt.figure(figsize=(6, 4))
plt.plot(x, y)
plt.title("y=mx+c")
plt.xlabel("x-axis")
plt.ylabel("y-axis")

plt.show()
输出:
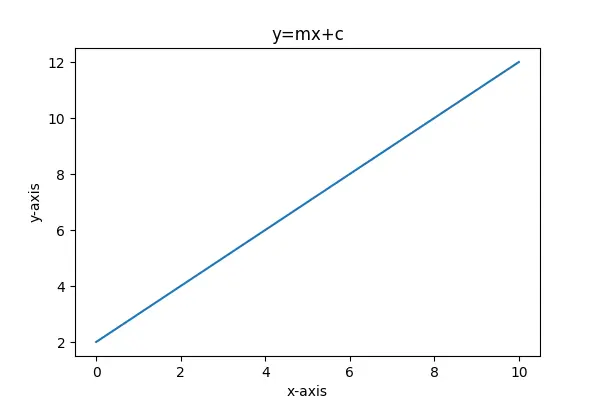
figsize 参数的默认值为 [6.4, 4.8]。
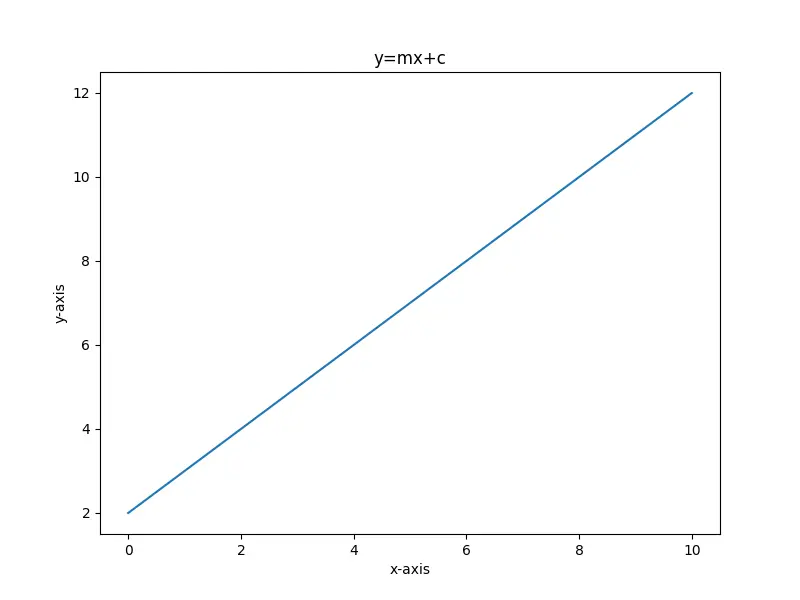
设置 rcParams 来更改 Matplotlib 中图形的大小
我们可以更改存储在 matplotlib.rcParams 字典中的默认 figure.figsize 值,以更改 Matplotlib 中的图形大小。
import numpy as np
import matplotlib.pyplot as plt

x = np.linspace(0, 10, 20)
m = 1
c = 2
y = m * x + c

plt.rcParams["figure.figsize"] = (8, 6)
plt.plot(x, y)
plt.title("y=mx+c")
plt.xlabel("x-axis")
plt.ylabel("y-axis")

plt.show()
输出:
set_figheight() 和 set_figwidth() 一起设置 Matplotlib 图形大小
如果已经创建了图形,我们可以使用 set_figheight() 和 set_figwidth() 方法来确定图形的大小。
import numpy as np
import matplotlib.pyplot as plt

x = np.linspace(0, 10, 20)
m = 1
c = 2
y = m * x + c

fig = plt.figure()
plt.plot(x, y)
plt.title("y=mx+c")
plt.xlabel("x-axis")
plt.ylabel("y-axis")
fig.set_figheight(6)
fig.set_figwidth(8)

plt.show()
输出:
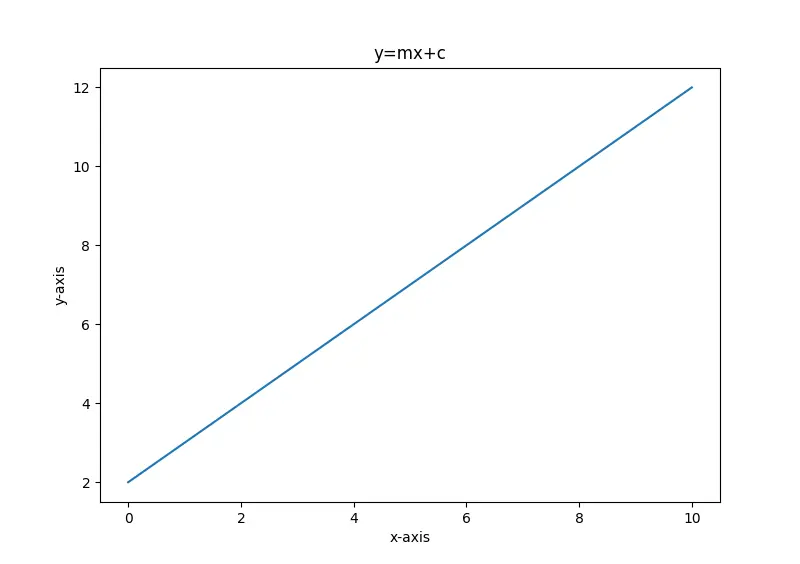
这里,set_figheight() 方法设置图形的高度,而 set_figwidth() 方法设置图形的宽度。
set_size_inches() 方法来更改 Matplotlib 图形大小
创建图形后,此方法还可以设置图形大小。
import numpy as np
import matplotlib.pyplot as plt

x = np.linspace(0, 10, 20)
m = 1
c = 2
y = m * x + c

fig = plt.figure()
plt.plot(x, y)
plt.title("y=mx+c")
plt.xlabel("x-axis")
plt.ylabel("y-axis")
fig.set_size_inches(5, 5)

plt.show()
输出:

在这里,传递给 set_size_inches() 方法的参数分别表示图形的宽度和高度(以英寸为单位)。
在 Matplotlib 中更改图形格式
要更改图形格式,我们可以使用 savefig() 方法更改图像文件的扩展名。我们可以将图保存为不同的格式,例如 png,jpg,svg,pdf 等。
import numpy as np
import matplotlib.pyplot as plt

x = np.linspace(0, 10, 20)
m = 1
c = 2
y = m * x + c

fig = plt.figure()
plt.plot(x, y)
plt.title("y=mx+c")
plt.xlabel("x-axis")
plt.ylabel("y-axis")
fig.set_size_inches(5, 5)

plt.savefig("Figure saved in jpg format.jpg")
这会将图形保存为 jpg 格式。
Enjoying our tutorials? Subscribe to DelftStack on YouTube to support us in creating more high-quality video guides. Subscribe
作者: Suraj Joshi

Suraj Joshi is a backend software engineer at Matrice.ai.
LinkedIn