Matplotlib で図のサイズとその形式を変更する方法
-
初期化中に
figure()メソッドでfigsizeを設定する -
Matplotlib の Figure のサイズを変更するには、
rcParamsを設定する -
Matplotlib の
Figureサイズを設定するためのset_figheight()とset_figwidth() -
Figure のサイズを変更するための
set_size_inches()メソッド - Matplotlib で図の形式を変更する

set_figheight() を set_figwidth() および set_size_inches() メソッドと一緒に使用して、Matplotlib で図のサイズを変更できます。figure() メソッドで figsize を設定し、rcParams を設定することで、Matplotlib で図のサイズを変更することもできます。同様に、図の形式を変更するには、savefig() メソッドで画像ファイルの拡張子を変更するだけです。
初期化中に figure() メソッドで figsize を設定する
図の幅と高さをインチで指定する初期化時に、figure() メソッドで figsize パラメーターの値を設定できます。
import numpy as np
import matplotlib.pyplot as plt

x = np.linspace(0, 10, 0.5)
m = 1
c = 2
y = m * x + c

plt.figure(figsize=(6, 4))
plt.plot(x, y)
plt.title("y=mx+c")
plt.xlabel("x-axis")
plt.ylabel("y-axis")

plt.show()
出力:
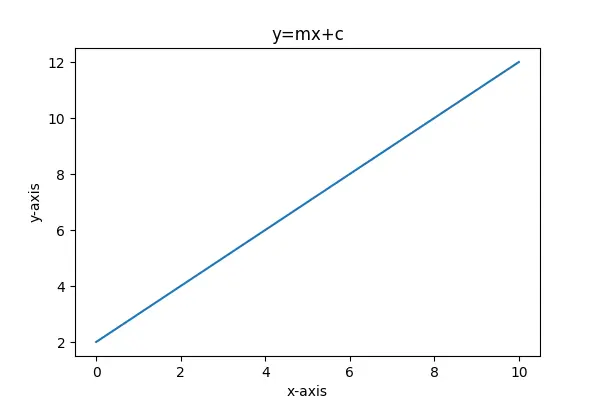
figsize パラメータのデフォルト値は [6.4, 4.8] です。
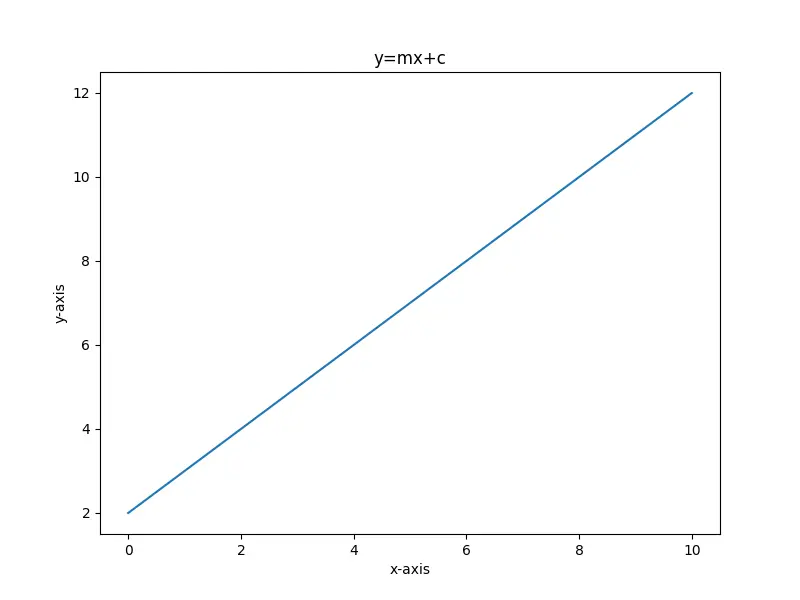
Matplotlib の Figure のサイズを変更するには、rcParams を設定する
matplotlib.rcParams ディクショナリに保存されているデフォルトの figure.figsize 値を変更して、Matplotlib の Figure サイズを変更できます。
import numpy as np
import matplotlib.pyplot as plt

x = np.linspace(0, 10, 20)
m = 1
c = 2
y = m * x + c

plt.rcParams["figure.figsize"] = (8, 6)
plt.plot(x, y)
plt.title("y=mx+c")
plt.xlabel("x-axis")
plt.ylabel("y-axis")

plt.show()
出力:
Matplotlib の Figure サイズを設定するための set_figheight() と set_figwidth()
フィギュアがすでに作成されている場合は、set_figheight() および set_figwidth() メソッドを使用してフィギュアのサイズを変更できます。
import numpy as np
import matplotlib.pyplot as plt

x = np.linspace(0, 10, 20)
m = 1
c = 2
y = m * x + c

fig = plt.figure()
plt.plot(x, y)
plt.title("y=mx+c")
plt.xlabel("x-axis")
plt.ylabel("y-axis")
fig.set_figheight(6)
fig.set_figwidth(8)

plt.show()
出力:
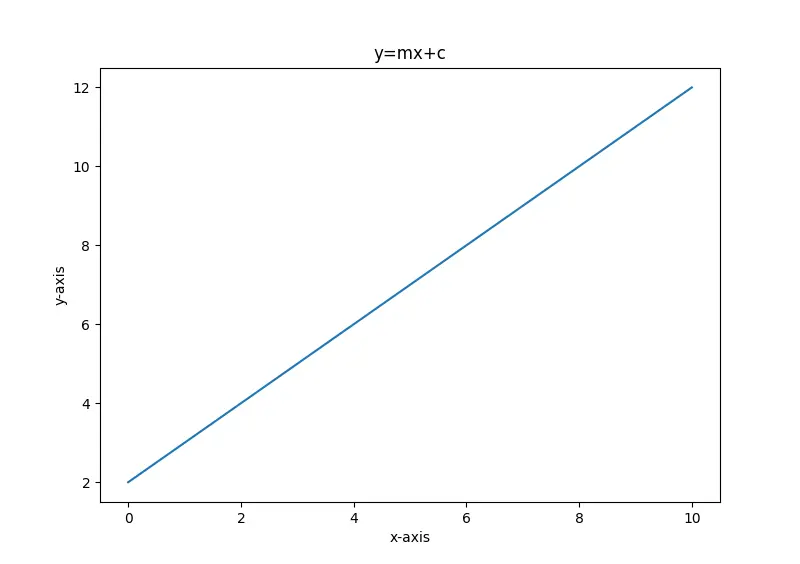
ここで、set_figheight() メソッドは図の高さを設定し、set_figwidth() は図の幅を設定します。
Figure のサイズを変更するための set_size_inches() メソッド
このメソッドは、図が作成された後に図のサイズを設定することもできます。
import numpy as np
import matplotlib.pyplot as plt

x = np.linspace(0, 10, 20)
m = 1
c = 2
y = m * x + c

fig = plt.figure()
plt.plot(x, y)
plt.title("y=mx+c")
plt.xlabel("x-axis")
plt.ylabel("y-axis")
fig.set_size_inches(5, 5)

plt.show()
出力:

ここで、set_size_inches() メソッドに渡される引数は、図の幅と高さをそれぞれインチで表します。
Matplotlib で図の形式を変更する
図の形式を変更するには、savefig() メソッドで画像ファイルの拡張子を変更します。png、jpg、svg、pdf などのさまざまな形式でプロットを保存できます。
import numpy as np
import matplotlib.pyplot as plt

x = np.linspace(0, 10, 20)
m = 1
c = 2
y = m * x + c

fig = plt.figure()
plt.plot(x, y)
plt.title("y=mx+c")
plt.xlabel("x-axis")
plt.ylabel("y-axis")
fig.set_size_inches(5, 5)

plt.savefig("Figure saved in jpg format.jpg")
これにより、図が pdf 形式で保存されます。

Suraj Joshi is a backend software engineer at Matrice.ai.
LinkedIn