Matplotlib での pyplot.figure()の使用
Suraj Joshi
2023年1月30日
Matplotlib
Matplotlib Figure

このチュートリアルでは、matplotlib.pyplot.figure() を使って Matplotlib 図の様々なプロパティを変更する方法を説明します。Matplotlib 図は、単にプロットのすべての軸とプロパティのトップレベルのコンテナです。Matplotlib 図形の詳細については、公式ドキュメントページを参照してください。
図のプロパティを設定するには、matplotlib.pyplot.figure() を使用する
matplotlib.pyplot.figure(num=None,
                         figsize=None,
                         dpi=None,
                         facecolor=None,
                         edgecolor=None,
                         frameon=True,
                         FigureClass= < class 'matplotlib.figure.Figure' > ,
                         clear=False,
                         **kwargs)
matplotlib.pyplot.figure() を使って新しい図を作成し、figsize、dpi などの様々なパラメータを設定してプロットをカスタマイズすることができます。
例:図のプロパティを設定するには matplotlib.pyplot.figure() を使用する
import matplotlib.pyplot as plt

x = [1, 2, 3, 4, 5, 6]
y = [4, 3, 5, 6, 7, 4]

plt.figure(figsize=(8, 6), facecolor="yellow")

plt.plot(x, y)
plt.xlabel("X")
plt.ylabel("Y")
plt.title("Plot with figsize (8,6)")
plt.show()
出力:
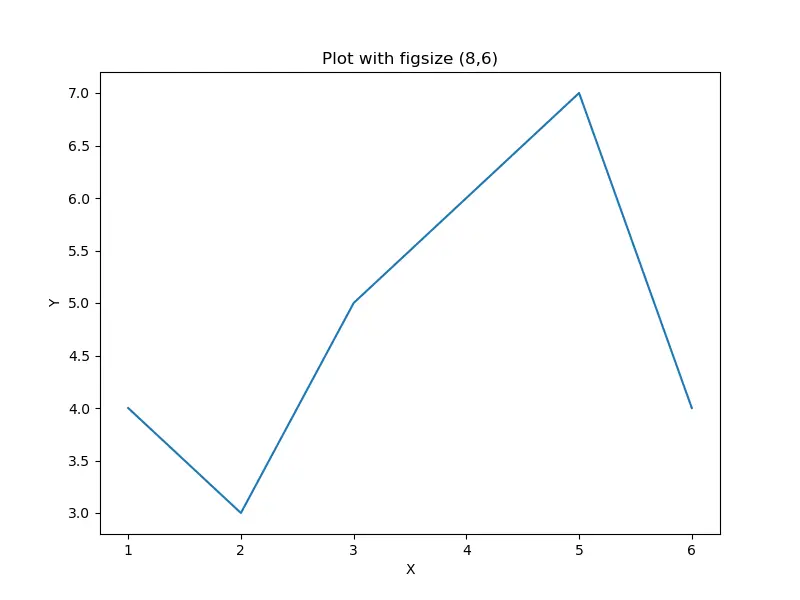
図形オブジェクトを作成し、図形の幅を 8 インチ、高さを 6 インチに設定します。顔の色は黄色に設定されています。
matplotlib.pyplot.figure() を使用してサブプロットを図に追加する
これは add_subplot() メソッドを用いて サブプロット を図に追加するために用いられます。
import matplotlib.pyplot as plt

x = [1, 2, 3, 4, 5, 6]
y = [4, 3, 5, 6, 7, 4]

fig = plt.figure()

subplot1 = fig.add_subplot(2, 1, 1)
subplot1.plot(x, y)

subplot2 = fig.add_subplot(2, 1, 2)
subplot2.text(0.3, 0.5, "2nd Subplot")

fig.suptitle("Add subplots to a figure")
plt.show()
出力:
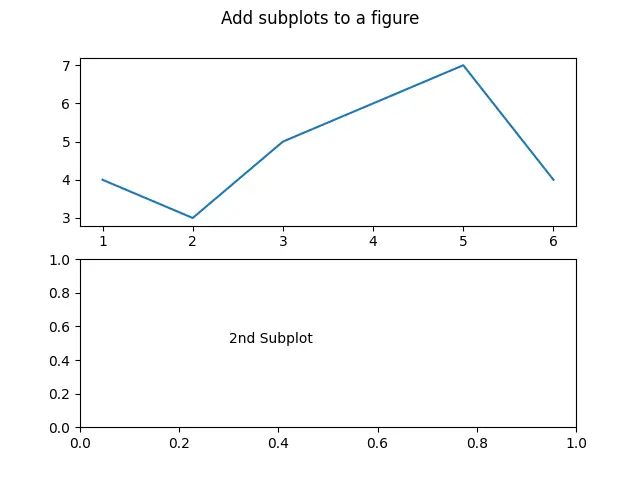
これは、matplotlib.pyplot.figure() メソッドを用いて作成された図形オブジェクト fig に 2つのサブプロットを追加します。
チュートリアルを楽しんでいますか? <a href="https://www.youtube.com/@delftstack/?sub_confirmation=1" style="color: #a94442; font-weight: bold; text-decoration: underline;">DelftStackをチャンネル登録</a> して、高品質な動画ガイドをさらに制作するためのサポートをお願いします。 Subscribe
著者: Suraj Joshi

Suraj Joshi is a backend software engineer at Matrice.ai.
LinkedIn