How to Save Figures Identical to the Displayed Figures in Matplotlib
- Saving Figures Using the Savefig Method
- Adjusting Layout with Tight Layout
- Saving in Different Formats
- Customizing Figure Size
- Conclusion
- FAQ
Matplotlib is a powerful library for creating static, animated, and interactive visualizations in Python. One common task that many users face is saving figures that look exactly like the ones displayed on their screen. Whether you’re preparing figures for a publication, a presentation, or just for your own records, it’s crucial to ensure that the saved figures maintain the same quality and appearance as those displayed.
In this article, we will explore various methods to save figures in Matplotlib while ensuring that they are identical to what you see on your display. We’ll provide clear explanations and code examples to help you master this essential skill.
Saving Figures Using the Savefig Method
The most straightforward way to save a figure in Matplotlib is by using the savefig method. This method allows you to specify various parameters, such as the filename, the format, and the DPI (dots per inch) for resolution. The beauty of savefig is that it captures the figure exactly as it appears on your screen, making it an ideal choice for saving high-quality images.
Here’s a simple example:
import matplotlib.pyplot as plt
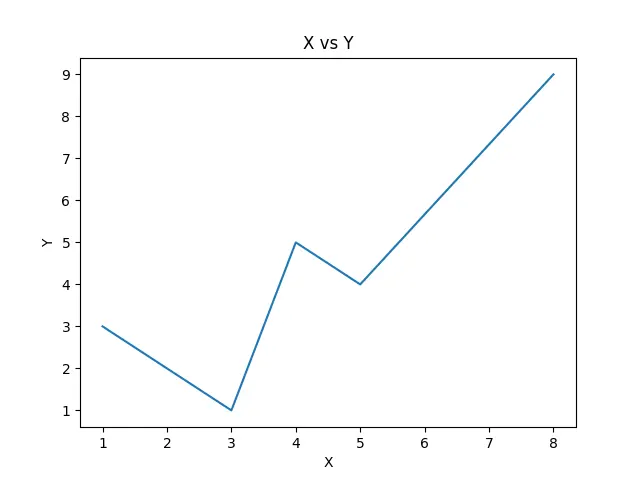
x = [1, 3, 4, 5, 8]
y = [3, 1, 5, 4, 9]
fig = plt.figure()
plt.plot(x, y)
plt.xlabel("X")
plt.ylabel("Y")
plt.title("X vs Y")
fig.savefig("plot.png", dpi=fig.dpi)
plt.show()
Output:

Saved Figure:
In this example, we first create a simple line plot. The savefig function is called before plt.show(), which is essential. If you call savefig after plt.show(), it will save a blank figure since the interactive window has already been rendered. The dpi parameter is set to 300 for high resolution, which is particularly useful for print quality. You can change the file format by simply altering the file extension in the filename, such as .jpg, .pdf, or .svg.
Adjusting Layout with Tight Layout
Sometimes, when you save figures in Matplotlib, you may notice that labels or titles are cut off. This often happens because the default layout does not account for the size of the elements in your plot. To resolve this, you can use the tight_layout method before saving your figure. This method automatically adjusts the subplot parameters to give specified padding.
Here’s how you can implement it:
import matplotlib.pyplot as plt

plt.plot([1, 2, 3], [4, 5, 6])
plt.title('Sample Plot with Tight Layout')
plt.xlabel('X-axis')
plt.ylabel('Y-axis')

plt.tight_layout()
plt.savefig('tight_layout_plot.png', dpi=300)

plt.show()
Output:
A file named 'tight_layout_plot.png' is created with adjusted layout.
Using tight_layout() ensures that all elements of your plot fit well within the figure area, preventing any clipping of labels or titles. This is particularly useful when you have multiple subplots or longer text labels. After making these adjustments, you can save the figure as before, ensuring that it appears just like it does on your screen.
Saving in Different Formats
Matplotlib supports various file formats, and knowing how to save your figures in different formats can be beneficial depending on your needs. For instance, vector formats like PDF and SVG are great for publications, while raster formats like PNG and JPEG are suitable for web use. The savefig method allows you to easily switch between these formats by simply changing the file extension.
Here’s an example of saving the same figure in different formats:
import matplotlib.pyplot as plt

plt.plot([1, 2, 3], [4, 5, 6])
plt.title('Sample Plot in Multiple Formats')
plt.xlabel('X-axis')
plt.ylabel('Y-axis')

plt.savefig('plot.pdf', dpi=300)
plt.savefig('plot.svg', dpi=300)
plt.savefig('plot.png', dpi=300)

plt.show()
Output:
Files named 'plot.pdf', 'plot.svg', and 'plot.png' are created in the current directory.
In this example, we save the same plot in three different formats. The dpi parameter can be specified for raster formats, but it is ignored for vector formats like PDF and SVG. This flexibility allows you to create high-quality figures suitable for various applications. Always consider your audience and the medium through which your figures will be displayed.
Customizing Figure Size
The size of your figure can significantly impact how your data is perceived. Matplotlib allows you to customize the figure size using the figsize parameter in the figure function. This can be particularly useful when you want to create figures that fit specific dimensions for presentations or publications.
Here’s how you can set the figure size:
import matplotlib.pyplot as plt

plt.figure(figsize=(10, 5))
plt.plot([1, 2, 3], [4, 5, 6])
plt.title('Custom Figure Size')
plt.xlabel('X-axis')
plt.ylabel('Y-axis')

plt.savefig('custom_size_plot.png', dpi=300)

plt.show()
Output:
A file named 'custom_size_plot.png' with a size of 10x5 inches is created.
In this code snippet, we specify the figure size as 10 inches wide and 5 inches tall. This customization allows for better control over how your figures will be presented, ensuring they fit well within the context where they will be used. The aspect ratio can greatly affect the readability of your plots, so take time to adjust it according to your needs.
Conclusion
Saving figures that are identical to the displayed ones in Matplotlib is a straightforward process once you know the right methods. By using the savefig function, adjusting layouts with tight_layout, customizing figure sizes, and choosing the appropriate file formats, you can ensure that your saved figures maintain their quality and clarity. Whether you are preparing figures for academic papers, presentations, or personal projects, mastering these techniques will enhance your data visualization skills significantly.
FAQ
-
How do I save a Matplotlib figure in high resolution?
You can save a figure in high resolution by using thedpiparameter in thesavefigmethod, setting it to a higher value like 300. -
Can I save figures in vector formats?
Yes, you can save figures in vector formats like PDF or SVG by changing the file extension in thesavefigmethod. -
What should I do if my labels are cut off when saving?
Use thetight_layout()function before saving your figure to adjust the layout and prevent clipping of labels or titles. -
How can I change the size of my saved figure?
You can change the size by specifying thefigsizeparameter in thefigurefunction, allowing you to control the dimensions of your plot. -
Is it possible to save multiple figures at once?
Yes, you can use a loop to create and save multiple figures in different formats or with different data.

Suraj Joshi is a backend software engineer at Matrice.ai.
LinkedIn