How to Hide Axis, Borders and White Spaces in Matplotlib
Matplotlib is one of the most popular libraries for data visualization in Python. As you dive deeper into creating stunning plots, you may find yourself wanting to refine your visuals by hiding axes, borders, and any unwanted white spaces. This can be particularly useful when you want to focus the viewer’s attention on the data itself, without distractions.
In this tutorial, we will explore how to easily hide the axis using the matplotlib.pyplot.axis('off') command and remove all extraneous white spaces and borders when saving your figure. By the end of this article, you’ll have the tools you need to create cleaner, more professional-looking visualizations.
Hiding the Axis in Matplotlib
To hide the axis in a Matplotlib plot, you can use the axis('off') command. This simple command effectively removes the x and y axes from your figure, allowing your data to take center stage. Here’s a quick example of how to implement this in your code.
import numpy as np
import matplotlib.pyplot as plt

img = np.random.randn(10, 10)
plt.imshow(img)
plt.axis("off")

plt.show()
Output:
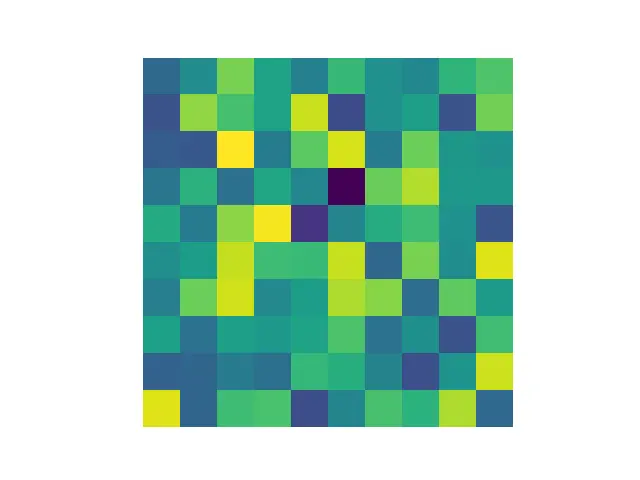
In this code snippet, we first import the necessary libraries, matplotlib.pyplot and numpy. Then we generate a 10x10 array of random numbers from a standard normal distribution and display it as a heatmap-like image. After plotting, we call plt.axis('off') to hide the axes. Finally, the plt.show() command displays the plot. This is particularly useful when you want to present data in a more aesthetic format, such as in presentations or reports, where the axes may not add value to the interpretation of the data.
Removing Borders and White Spaces
Once you’ve hidden the axes, the next step is to remove any borders and white spaces around your plot. This can be achieved by adjusting the figure’s layout before saving it. The tight_layout() function is particularly useful for this purpose. Here’s how you can use it:
plt.plot(x, y)
plt.axis('off')
plt.tight_layout()
plt.savefig('sine_wave.png', bbox_inches='tight', pad_inches=0)
In this example, the plt.tight_layout() function automatically adjusts the subplot parameters to give specified padding. To save the figure without any borders or white spaces, we use plt.savefig() with the bbox_inches='tight' and pad_inches=0 parameters. The bbox_inches='tight' option ensures that the bounding box of the figure is tight around the area containing the data, while pad_inches=0 removes any extra padding around the figure. This technique is essential for creating clean, professional images, especially for publications or presentations.
Conclusion
In this article, we explored two essential techniques for enhancing your Matplotlib visualizations: hiding axes and removing borders and white spaces. By utilizing the axis('off') command and adjusting the layout when saving your figures, you can create cleaner and more focused plots. These techniques not only improve the aesthetic quality of your visualizations but also help convey your data more effectively. Whether you’re preparing for a presentation or simply want to refine your plots, mastering these methods will elevate your data visualization skills.
FAQ
- How can I hide the grid lines in a Matplotlib plot?
You can hide grid lines by callingplt.grid(False)before displaying or saving your plot.
-
What is the purpose of using
bbox_inches='tight'inplt.savefig()?
This parameter ensures that the saved figure is tightly cropped around the actual content, eliminating unnecessary white spaces. -
Can I hide specific axes instead of both?
Yes, you can hide specific axes by usingplt.gca().axes.get_xaxis().set_visible(False)for the x-axis orplt.gca().axes.get_yaxis().set_visible(False)for the y-axis. -
How do I adjust the size of my figure in Matplotlib?
You can adjust the figure size using theplt.figure(figsize=(width, height))function, where width and height are in inches. -
Is it possible to customize the appearance of the axes before hiding them?
Absolutely! You can customize the appearance of axes using various Matplotlib functions before hiding them, such as changing colors or line styles.

Suraj Joshi is a backend software engineer at Matrice.ai.
LinkedIn