How to Add Text Inside the Plot in Matplotlib
-
Understanding the
plt.text()Method - Customizing Text Appearance
- Adding Annotations with Arrows
- Using Multi-line Text
- Conclusion
- FAQ
Adding text to plots in Matplotlib can significantly enhance the readability and effectiveness of your visualizations. Whether you want to label data points, provide annotations, or simply add a title, the plt.text() method is your go-to function.
In this tutorial, we’ll explore how to effectively use this method to place text within your figures and axes. By the end, you’ll be equipped with the knowledge to make your plots not only informative but also visually appealing. So, let’s dive into the world of Matplotlib and see how we can elevate our data visualizations with text!
Understanding the plt.text() Method
The plt.text() method in Matplotlib allows you to add text to your plots at specified coordinates. This method is versatile and can be used to annotate points, label axes, or provide additional context to your data. The basic syntax includes parameters for the x and y coordinates, the text you want to display, and optional parameters to customize font size, color, and alignment.
Here’s a simple example to illustrate how to use plt.text():
import matplotlib.pyplot as plt
x = [1, 2, 3, 4]
y = [10, 20, 25, 30]
plt.plot(x, y, marker='o')
plt.title("Sample Plot")
plt.xlabel("X-axis")
plt.ylabel("Y-axis")
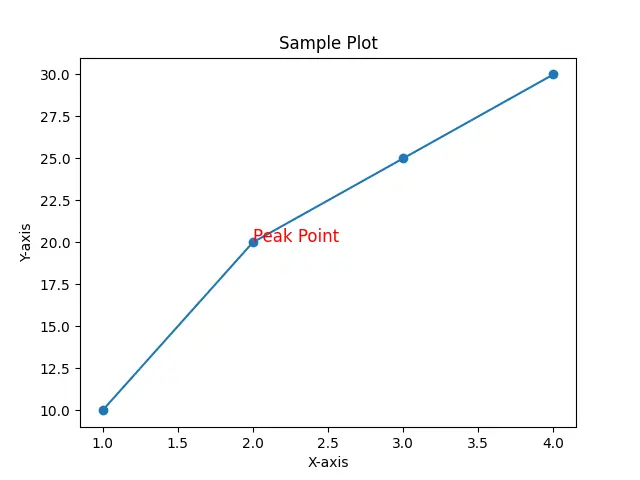
plt.text(2, 20, "Peak Point", fontsize=12, color='red')
plt.show()
Output:
A line plot with a peak point labeled in red at (2, 20).
In this example, we create a simple line plot with points marked by circles. The plt.text() function is used to place the label “Peak Point” at the coordinates (2, 20) on the plot. The text is styled with a font size of 12 and colored red, making it stand out against the plot background. This method is particularly useful for highlighting important data points or trends.
Customizing Text Appearance
One of the strengths of Matplotlib is its flexibility in customizing text appearance. You can adjust font size, color, weight, and even the rotation of the text. This customization helps to ensure that your text is not only informative but also visually appealing.
Let’s take a look at an example that demonstrates how to customize text appearance:
import matplotlib.pyplot as plt

x = [1, 2, 3, 4]
y = [10, 15, 25, 30]

plt.plot(x, y, marker='o')
plt.title("Customized Text Example")
plt.xlabel("X-axis")
plt.ylabel("Y-axis")
plt.text(3, 25, "Important Point", fontsize=14, color='blue', fontweight='bold', rotation=45)

plt.show()
Output:
In this code, we modify the text properties to enhance visibility and impact. The label “Important Point” is displayed in blue, bold, and rotated at a 45-degree angle. Such customization allows you to tailor the text to match the overall aesthetics of your plot, making it easier for viewers to grasp the key messages.
Adding Annotations with Arrows
To further enhance your plots, you can use annotations that include arrows pointing to specific data points. This feature is particularly useful for drawing attention to significant trends or outliers in your data. The plt.annotate() function is ideal for this purpose.
Here’s how you can use it:
import matplotlib.pyplot as plt

x = [1, 2, 3, 4]
y = [10, 15, 25, 30]

plt.plot(x, y, marker='o')
plt.title("Annotation Example")
plt.xlabel("X-axis")
plt.ylabel("Y-axis")
plt.annotate("Highest Point", xy=(3, 25), xytext=(2, 20),
             arrowprops=dict(facecolor='black', shrink=0.05))

plt.show()
Output:
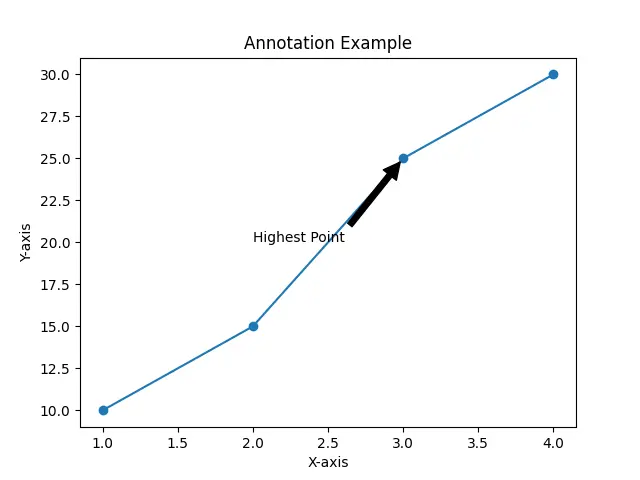
In this example, the plt.annotate() function is used to add an annotation that points to the highest data point (3, 25). The xy parameter specifies the point being annotated, while xytext indicates where the text should appear. Additionally, the arrowprops parameter customizes the arrow’s appearance, making it clear which point the text refers to. Annotations like this can make your plots more informative and engaging.
Using Multi-line Text
Sometimes, a single line of text isn’t enough to convey your message. Luckily, Matplotlib allows you to add multi-line text to your plots. This can be particularly useful for providing detailed explanations or notes directly on the graph.
Here’s how you can implement multi-line text using plt.text():
import matplotlib.pyplot as plt

x = [1, 2, 3, 4]
y = [10, 15, 25, 30]

plt.plot(x, y, marker='o')
plt.title("Multi-line Text Example")
plt.xlabel("X-axis")
plt.ylabel("Y-axis")
plt.text(2, 15, "This is an example\nof multi-line text\nin Matplotlib", fontsize=12, color='green')

plt.show()
Output:
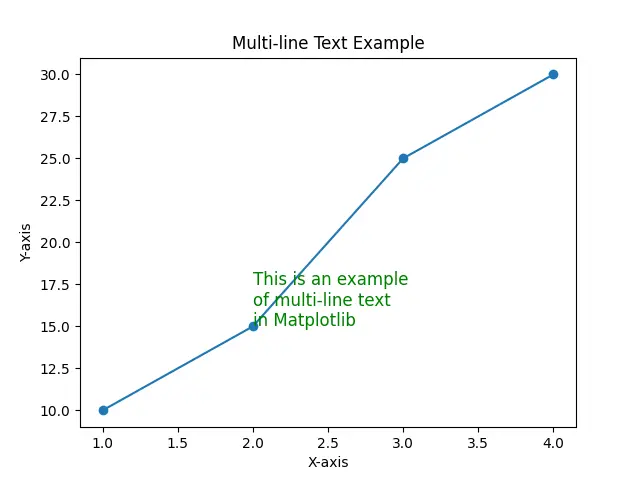
In this example, we use the newline character \n to create multi-line text. The text “This is an example\nof multi-line text\nin Matplotlib” is displayed at the coordinates (2, 15). This feature is great for adding more context or explanations without cluttering the plot with too many separate text elements. By organizing your information in a multi-line format, you can keep your plots clean and informative.
Conclusion
Adding text to your Matplotlib plots can transform your visualizations from simple graphs into powerful storytelling tools. Whether you’re labeling key points, providing additional context, or using annotations to guide your audience, the plt.text() and plt.annotate() methods are invaluable. Moreover, the ability to customize text appearance and create multi-line annotations allows you to tailor your plots to your audience’s needs. With these techniques in your toolkit, you’re well on your way to creating engaging and informative data visualizations.
FAQ
-
What is the purpose of the plt.text() method in Matplotlib?
The plt.text() method is used to add text to a plot at specified coordinates, enhancing the readability and context of the visualization. -
How can I change the color and font size of the text in Matplotlib?
You can customize the text color and font size by using thecolorandfontsizeparameters in the plt.text() method. -
Can I add arrows to my annotations in Matplotlib?
Yes, you can use the plt.annotate() function to add arrows that point to specific data points in your plot. -
How do I create multi-line text in Matplotlib?
You can create multi-line text by using the newline character\nwithin the text string in the plt.text() method. -
Is it possible to rotate text in Matplotlib?
Yes, you can rotate text using therotationparameter in the plt.text() method, allowing for greater flexibility in positioning your text.

Suraj Joshi is a backend software engineer at Matrice.ai.
LinkedIn