Practical solutions

R Howtos How-To Guides

Solve the problem. Keep building. Collection of R how-to articles

Find the answer you need

Browse practical solutions, grouped by the task you're working on.

__COUNT__ entries on this page

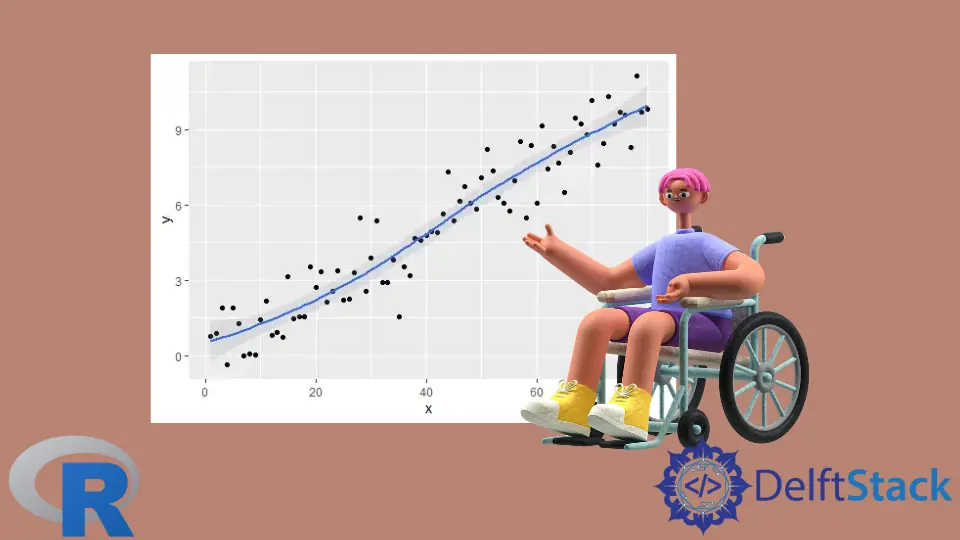
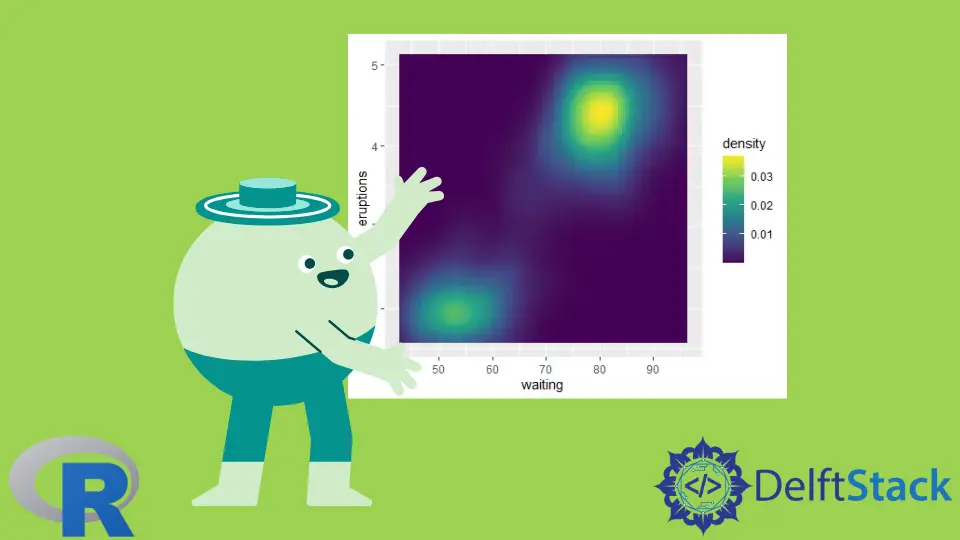
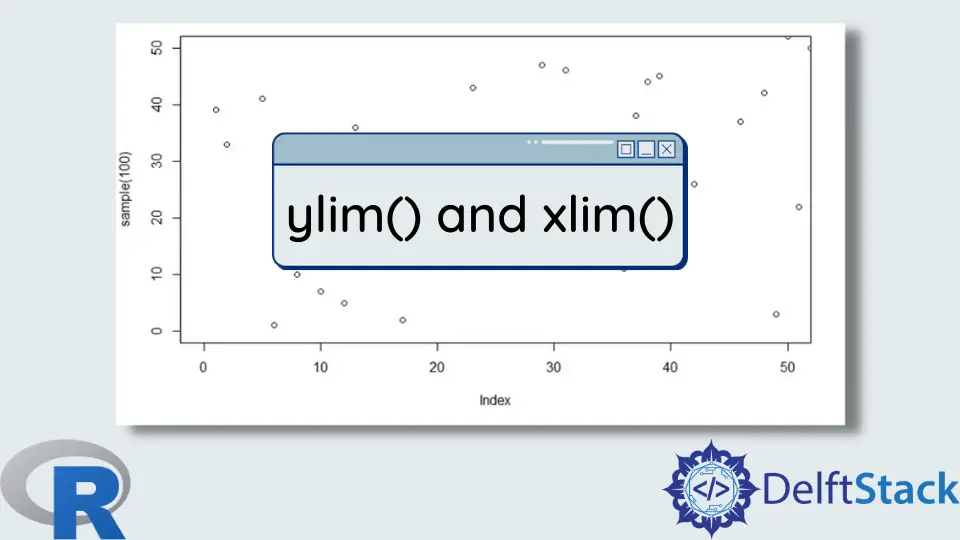
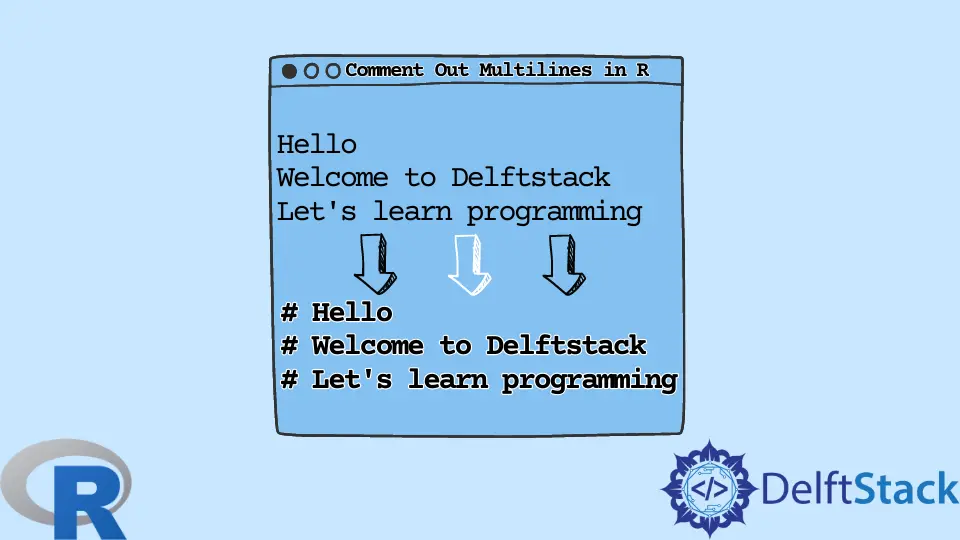
How to Perform Binomial Distribution in RThis tutorial demonstrates how to perform binomial distribution in R, covering essential functions like dbinom, pbinom, qbinom, and rbinom. Learn to calculate probabilities, cumulative distributions, and generate random samples effectively. Whether you are a beginner or an experienced data analyst, this guide will enhance your statistical analysis skills and help you make informed decisions based on binomial distribution. How to Install rtools in WindowsThis tutorial demonstrates how to install Rtools on Windows, providing a step-by-step guide for R users. Learn what Rtools is, why it's essential for building R packages, and how to troubleshoot common installation issues. Get started with your R programming journey today! How to Add Confidence Interval to Ggplot2 in RThis tutorial demonstrates how to add confidence intervals to ggplot2 in R. Learn step-by-step how to enhance your visualizations with confidence intervals, improving data interpretation and communication. Explore R's powerful packages and create informative plots that convey uncertainty effectively. How to Get the Number of Columns in RThis tutorial demonstrates how to get the number of columns in R. Learn various methods including ncol(), dim(), and colnames() functions to effectively manage your data frames. Whether you're a beginner or an experienced user, this guide will enhance your data analysis skills. How to Export Data Frame to CSV in RThis tutorial demonstrates how to export a data frame to CSV in R. Learn various methods such as using write.csv, write.table, and the readr package's write_csv function to efficiently save your data. Explore practical examples and detailed explanations to enhance your data exporting skills in R. scale_fill_continuous in RThis tutorial demonstrates how to use the scale_fill_continuous() method in R for effective data visualization. Learn to customize color scales, enhance your plots, and create visually appealing graphics with practical examples and insights. Whether you're a beginner or an experienced user, this guide will help you master this essential function in R. pch in RThis tutorial demonstrates the use of pch in R, focusing on how to customize plotting characters for enhanced data visualization. Learn how to effectively use pch to create informative and visually appealing plots with examples and detailed explanations. Ideal for beginners and experienced users alike, this guide will help you elevate your R plotting skills. Undefined Control Sequence Latex Using RThis tutorial explores the undefined control sequence error in LaTeX while using R. Learn how to troubleshoot and resolve this common issue effectively. Discover solutions like checking for typos, including missing packages, and using alternative commands. Equip yourself with the knowledge to create flawless LaTeX documents in R. How to Create Empty Vector in RThis tutorial demonstrates how to create an empty vector in R, covering various methods such as using the c() and vector() functions. Learn how to initialize empty vectors of different types, including numeric, character, and logical, with clear examples and explanations. Enhance your R programming skills by mastering this essential technique for data manipulation and analysis. How to Compute Natural Logarithm in RThis tutorial demonstrates how to compute natural logarithmic values in R effectively. Learn different methods, including using the log() function, creating custom functions, and utilizing the dplyr package for data frames. Perfect for beginners and experienced users, this guide will enhance your data analysis skills. e in RThis tutorial demonstrates how to calculate Euler's number in R using various methods, including the exp() function, Taylor series expansion, limit definition, and accessing R's built-in constant. Perfect for beginners and experienced programmers, this guide provides clear code examples and explanations to enhance your understanding of this fundamental mathematical constant. ylim() and xlim() in RThis tutorial explores how to effectively use ylim() and xlim() in R for setting axis limits in data visualizations. Learn how to enhance your plots with clear examples and detailed explanations. Discover the importance of controlling axis limits to emphasize key data trends and improve your visual storytelling skills. How to Calculate Standard Error in RThis tutorial demonstrates how to calculate the standard error of the mean in R. Learn various methods, including using base R functions, the dplyr package, and the psych package, complete with code examples and detailed explanations. Whether you're a beginner or an experienced data analyst, this guide will help you understand and compute standard error effectively. paste0() Function in RThis comprehensive tutorial explores the paste0() function in R, detailing its usage for string concatenation without separators. Learn how to effectively use paste0() with examples, from basic concatenation to advanced applications in data manipulation. Enhance your R programming skills and streamline your data analysis workflow with this essential function. How to Multiply Matrix in RLearn how to multiply matrices in R with this comprehensive tutorial. Explore various methods including the %*% operator, crossprod(), and tcrossprod(). Enhance your R programming skills with clear examples and detailed explanations. Perfect for beginners and experienced users alike, this guide will help you master matrix operations in R efficiently. Use the Tilde Symbol (~) in RThis tutorial demonstrates the use of tilde symbol (~) in R. How to Combine Two Data Frames in RThis tutorial shows different methods to merge two data frames in R: using the built-in rbind function, using the bind_rows function in the dplyr package, or writing a function that does the job faster when working with big data sets. R Continue for LoopIn this article, you will learn how to skip lines of code and jump to the next iteration in a for loop in R when some condition is met. How to Drop Column by Name in RThis tutorial demonstrates how to drop a column by name from a dataframe in R. How to Sort Data Frame by Column in RThis tutorial demonstrates how to sort data frame by column in R. How to Set Axis Limits in Ggplot2 R PlotsIn this article, we explain a few options to limit the axis ranges in ggplot2-generated charts. To illustrate the usage of the options, we will use a scatter plot, but the same technique could be used with any of the ggplot2 graph types. How to Comment Out Multilines in RIn this article, you will learn how to comment out multilines in R without having to manually write a # character at the beginning of each of the lines to comment out. How to Set Thickness of Plots in RThis tutorial demonstrates how to change the thickness of plots in R How to Break a for Loop in RThis article shows how to use the break keyword to terminate a for loop in R. It also examines the use of the break keyword in nested for loops and shows how print statements can help us understand the working of our break command.