How to Set Axis Limits in Ggplot2 R Plots
-
Set X-Axis Limits With
scale_x_continuousinggplot2 -
Use
coord_cartesianto Limit Both Axes inggplot2
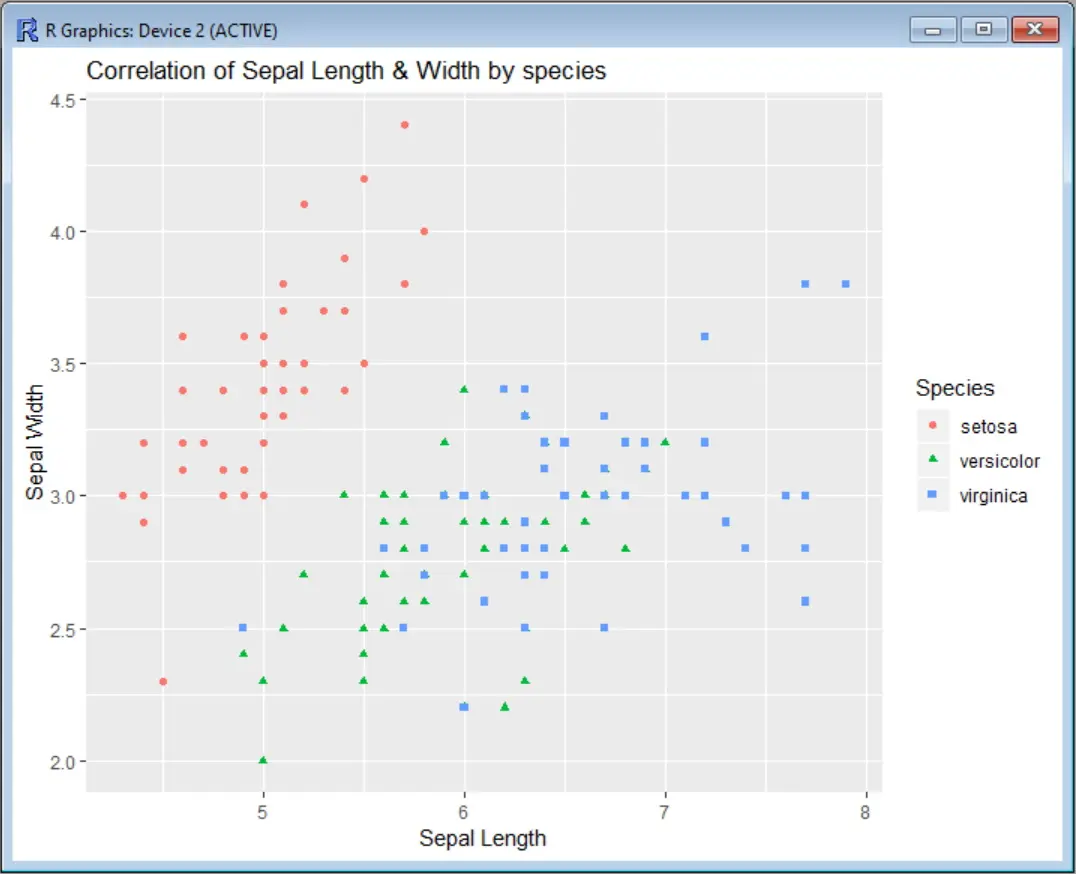
Let’s first see our scatter plot without putting any limit to the axis. In this example, we use the Iris data set to correlate the sepal width values and sepal width, categorizing the species by color. Before calling the ggplot function, we need to install the ggplot2 package and load the corresponding library:
install.packages("ggplot2")
library(ggplot2)
scatter <- ggplot(data=iris, aes(x = Sepal.Length, y = Sepal.Width))
scatter + geom_point(aes(color=Species, shape=Species)) +
 ylab("Sepal Width") + xlab("Sepal Length") +
 ggtitle("Correlation of Sepal Length & Width by species")
Output:
Now, suppose we want to limit the x-axis (Sepal Length) so that the plot shows only the region between x=5 and x=7. We have two options to do that: using scale_x_continuous or using coord_cartesian.
scale_x_continuous removes all data points that fall outside the specified range for the given axis, while coord_cartesian only adjusts the visible area. In most cases, both options will render the same results. But if you happen to fit something to the data, the fitted values would probably change.
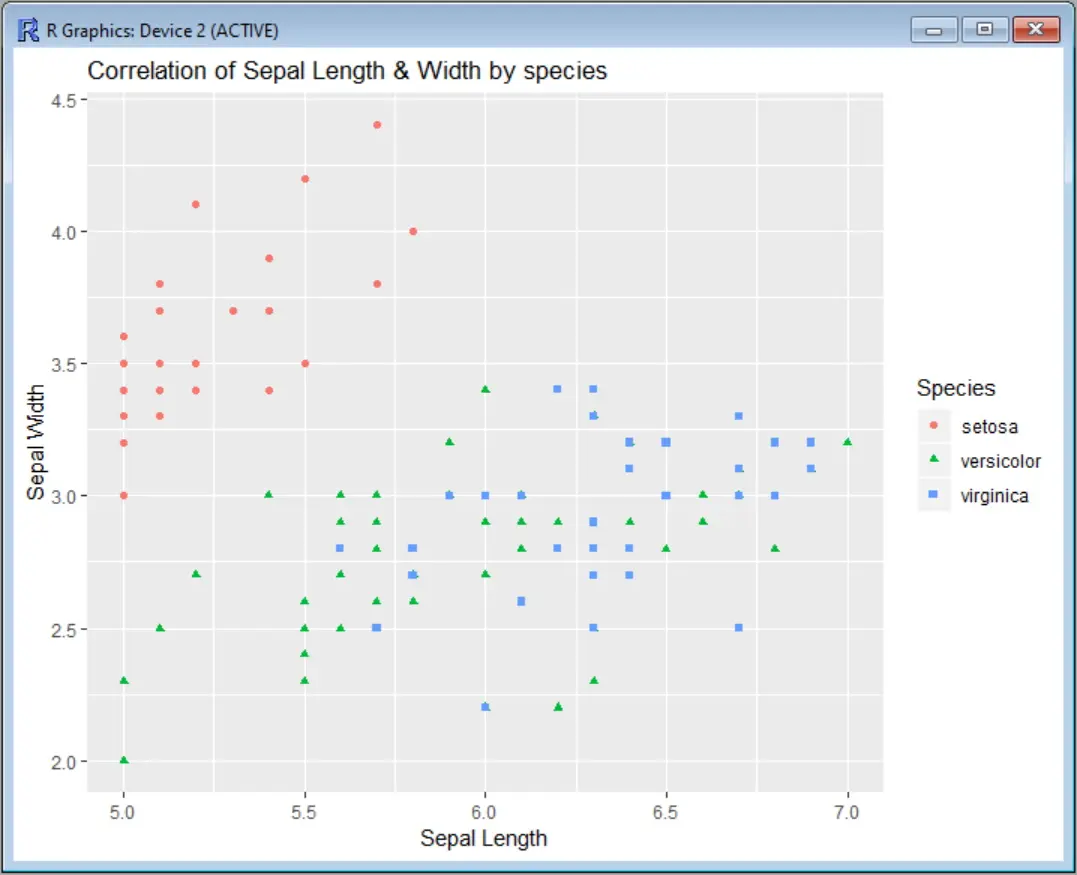
Set X-Axis Limits With scale_x_continuous in ggplot2
To use scale_x_continuous, you need to specify a vector with the lower and upper limits of the x-axis, like this:
scatter <- ggplot(data=iris, aes(x = Sepal.Length, y = Sepal.Width))
scatter + geom_point(aes(color=Species, shape=Species)) +
 ylab("Sepal Width") + xlab("Sepal Length") +
 ggtitle("Correlation of Sepal Length & Width by species") +
 scale_x_continuous(limits = c(5, 7))
Output:
You will also get a warning message telling you how many data points are eliminated from the graph:
Warning message:
Removed 34 rows containing missing values (geom_point).
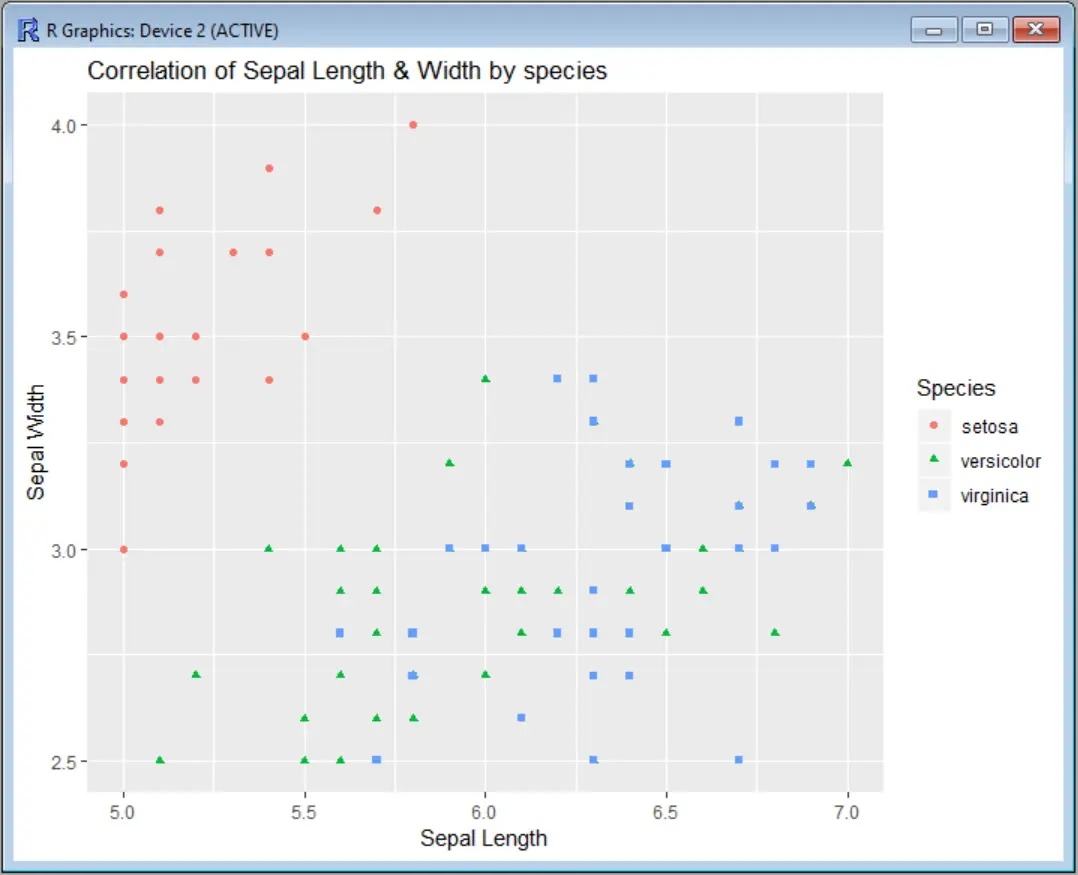
In case you also want to limit the y-axis, you can add scale_y_continuous the same way, as in this example:
scatter <- ggplot(data=iris, aes(x = Sepal.Length, y = Sepal.Width))
scatter + geom_point(aes(color=Species, shape=Species)) +
ylab("Sepal Width") + xlab("Sepal Length") +
ggtitle("Correlation of Sepal Length & Width by species") +
scale_x_continuous(limits = c(5, 7)) +
scale_y_continuous(limits = c(2.5, 4))
The output will show the limits on both axis:
You can also use the shorthand functions xlim and ylim instead of scale_x_continuous and scale_y_continuous to make the command a little shorter:
scatter <- ggplot(data=iris, aes(x = Sepal.Length, y = Sepal.Width))
scatter + geom_point(aes(color=Species, shape=Species)) +
  ylab("Sepal Width") + xlab("Sepal Length") +
  ggtitle("Correlation of Sepal Length & Width by species") +
  xlim(5, 7) + ylim(2.5, 4)
Use coord_cartesian to Limit Both Axes in ggplot2
If you want to use coord_cartesian instead of scale_x_continuous and scale_y_continuous, the command would be like this:
scatter <- ggplot(data=iris, aes(x = Sepal.Length, y = Sepal.Width))
scatter + geom_point(aes(color=Species, shape=Species)) +
 ylab("Sepal Width") + xlab("Sepal Length") +
 ggtitle("Correlation of Sepal Length & Width by species") +
 coord_cartesian(xlim = c(5, 7), ylim = c(2.5, 4))
And the plot output will be the same.
In the RStudio cheatsheet of ggplot2, you can find visual clarification for the use of all the options for this command.