Plot Background Color in R
-
Change Plot Background Color in R Using the
parFunction -
Change Plot Background Color in R Using the
ggplot2Package - Conclusion
R is a powerful statistical programming language that provides a variety of tools for data visualization. When creating plots in R, it’s not uncommon to customize the appearance to make them more visually appealing or to match specific design requirements.
One such customization is changing the background color of a plot. In this article, we’ll explore how to change the background color of a plot in R.
Change Plot Background Color in R Using the par Function
The par function, short for parameters, is a versatile tool in R for setting various graphical parameters that affect the appearance of plots. It allows users to customize aspects like margins, colors, font sizes, and more.
To change the background color of a plot, we’ll specifically focus on the bg parameter within the par function.
The syntax is as follows:
par(bg = "your_color")
This syntax sets the background color to the specified value, replacing your_color with the desired color name or code.
Example 1: Basic Background Color Change
Let’s start with a straightforward example. We generate a random dataset and create a boxplot, changing the background color of the entire plot.
# Example 1: Basic Background Color Change
Demo <- rnorm(1000)

# Set the grey background color
par(bg = "grey")

# Generate the plot
boxplot(Demo, col = "white")
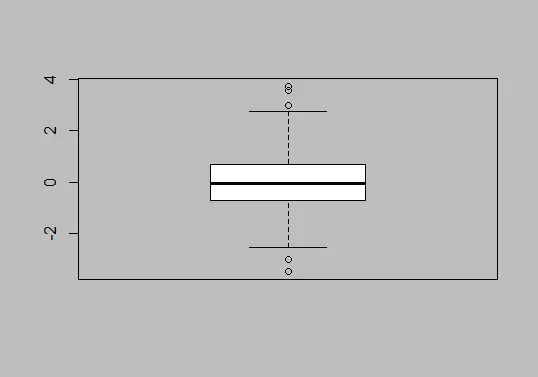
In this example, we start by generating a random dataset (Demo) with 1000 data points drawn from a normal distribution. The line par(bg = "grey") sets the background color of the entire plot to grey.
Subsequently, we create a boxplot of the Demo data with the boxplot function, specifying that the box color should be white (col = "white"). The resulting plot should exhibit a grey background, illustrating the successful modification of the overall background color.
Output:
Example 2: Changing Plot Region Background Color
To change the background color of the plot region specifically, we use the rect function in conjunction with par. The following code achieves this:
# Example 2: Changing Plot Region Background Color
Demo <- rnorm(1000)

# Basic plot
boxplot(Demo)

# Set plot region color
rect(
    par("usr")[1],
    par("usr")[3],
    par("usr")[2],
    par("usr")[4],
    col = "grey"
)

# Add the new plot
par(new = TRUE)

# Create the final plot
boxplot(Demo, col = "white")
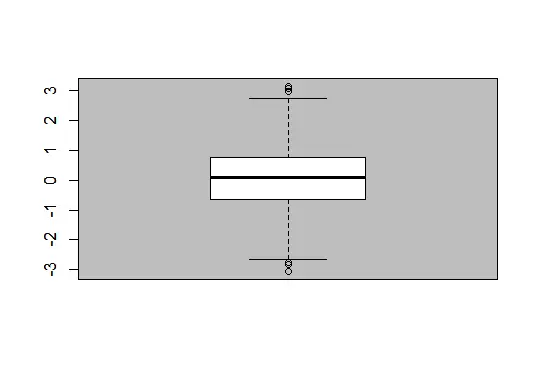
Initially, we create a basic boxplot of a random dataset (Demo). To change the plot region’s background color, we use the rect function.
The rect function draws a rectangle over the specified plot region, and in this case, the parameters provided by par("usr") define the boundaries of the plot region. The color of this rectangle is set to grey (col = "grey").
Additionally, we use par(new = TRUE) to add a new plot on top of the existing one, and finally, we create a boxplot with a white box color. This approach results in a plot with a grey background limited to the plot region.
Output:
Example 3: Differentiating Background and Plot Region Colors
To illustrate how to differentiate between the background color and plot region color, we can use two distinct colors in the following example:
# Example 3: Differentiating Background and Plot Region Colors
Demo <- rnorm(1000)

# Set the whole background color
par(bg = "lightblue")

# Basic plot
boxplot(Demo)

# Set plot region color
rect(
    par("usr")[1],
    par("usr")[3],
    par("usr")[2],
    par("usr")[4],
    col = "grey"
)

# Add the new plot
par(new = TRUE)

# Create final plot
boxplot(Demo, col = "white")
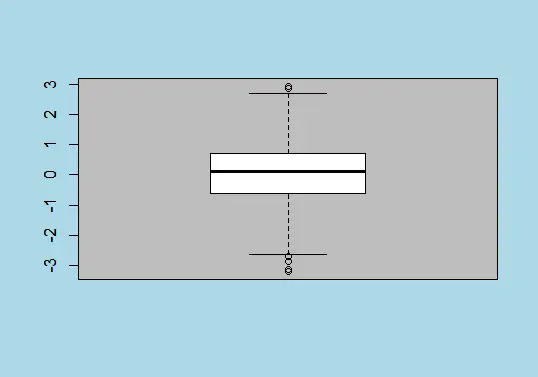
In this code, the entire background color is initially set to light blue using par(bg = "lightblue"). The basic boxplot is then created.
To modify the plot region’s background color, a grey rectangle is drawn using the rect function, similar to the previous example. The subsequent addition of a new plot and the creation of a boxplot with a white box color complete the customization.
This results in a plot where the entire background is light blue while the plot region exhibits a grey background.
Output:
These examples showcase the flexibility of the par function in changing the background color of plots in R.
Change Plot Background Color in R Using the ggplot2 Package
While the par function is a handy tool for customizing basic plots in R, the ggplot2 package provides a more modern and flexible approach to data visualization. ggplot2, developed by Hadley Wickham, is known for its simplicity and elegance in creating aesthetically pleasing and highly customizable plots.
In ggplot2, the theme function allows us to modify the appearance of plots. To change the background color, we can use the panel.background and plot.background elements within the theme function.
The syntax is as follows:
theme(panel.background = element_rect(fill = "your_color"))
This syntax sets the background color of the plot region (panel.background) to the specified color. Now, let’s dive into examples to illustrate how this works.
Before diving into customizing background colors, let’s make sure ggplot2 is installed and loaded in your R environment:
# Install and load ggplot2
install.packages("ggplot2")
library(ggplot2)
Example 1: Basic Background Color Change With ggplot2
To begin, let’s generate a simple scatter plot using ggplot2 and then modify the background color.
# Example 1: Basic Background Color Change with ggplot2
library("ggplot2")

# Create demo data
demo_data <- data.frame(x = 1:50, y = 1:50)

# Plot with ggplot2
ggplot(demo_data, aes(x, y)) +
    geom_point() + theme(panel.background = element_rect(fill = "lightblue"))
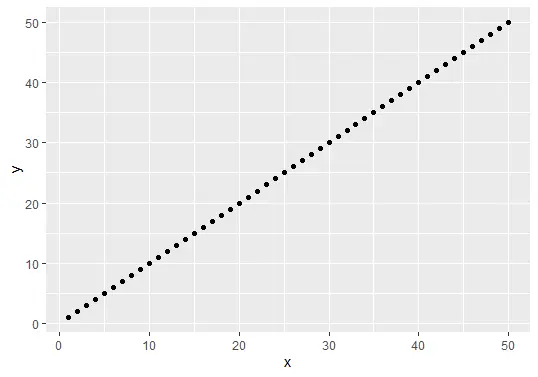
In this first example, we begin by loading the ggplot2 library and creating a dataset (demo_data) with x and y values. The plot is generated using ggplot and geom_point functions.
The significant line in this code is theme(panel.background = element_rect(fill = "lightblue")), which utilizes the theme function to set the background color of the plot region to light blue. This creates a visually appealing scatter plot with a light blue background in the plot region.
Output:
Example 2: Changing Plot Background Color With ggplot2
In this example, we continue with the same dataset and modify the entire plot’s background color using the plot.background element.
# Example 2: Changing Plot Background Color with ggplot2
library("ggplot2")

# Create demo data
demo_data <- data.frame(x = 1:50, y = 1:50)

# Plot with ggplot2
ggplot(demo_data, aes(x, y)) +
    geom_point() + theme(plot.background = element_rect(fill = "lightgreen"))
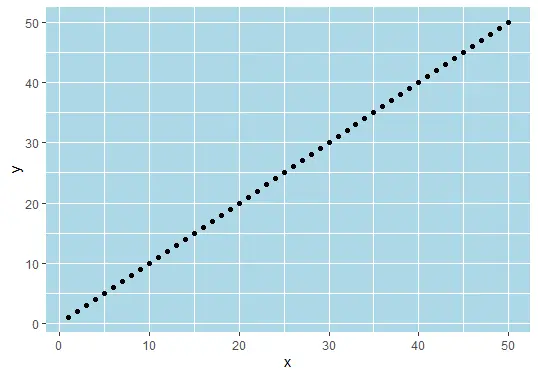
Here, we extend our customization to the entire plot’s background. The code snippet theme(plot.background = element_rect(fill = "lightgreen")) is pivotal here as it modifies the background color of the entire plot to light green.
The result is a scatter plot where both the plot region and the surrounding area have a cohesive light green background, providing a harmonious visual effect.
Output:
Example 3: Differentiating Background and Plot Region Colors
In this final example, we aim to differentiate between the background color and the plot region color.
# Example 3: Differentiating Background and Plot Region Colors
library("ggplot2")

# Create demo data
demo_data <- data.frame(x = 1:50, y = 1:50)

# Plot with ggplot2
ggplot(demo_data, aes(x, y)) +
    geom_point() + theme(
    panel.background = element_rect(fill = "lightgreen"),
    plot.background = element_rect(fill = "lightblue")
)
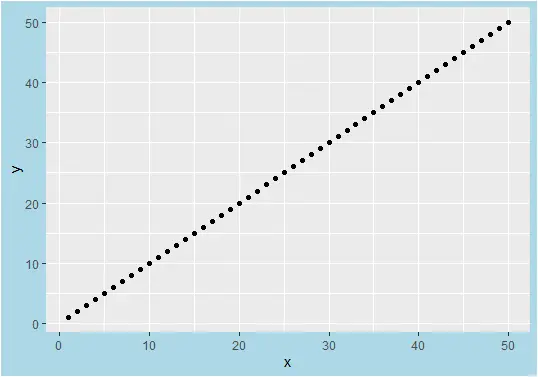
In this example code, we set the entire background color to light blue and the plot region color to light green. The key line in the code is theme(panel.background = element_rect(fill = "lightgreen"), plot.background = element_rect(fill = "lightblue")).
Here, both panel.background and plot.background elements are used within the theme function to achieve the desired distinction. This creates a scatter plot with a clear separation between the light blue background of the entire plot and the light green background of the plot region.
Output:
These examples showcase the high level of customization of the ggplot2 package in changing background colors for plots in different contexts. The theme function, along with element_rect, provides a straightforward way to customize the visual aspects of ggplot2 plots.
Conclusion
Customizing the background color of plots in R can be achieved through different approaches, providing flexibility based on individual preferences and specific plotting libraries. For basic plots using the par function in base R, the par(bg = "your_color") syntax allows for straightforward background color changes, either for the entire plot or specific plot regions.
On the other hand, the ggplot2 package offers a more versatile and aesthetically pleasing way to modify background colors. Using the theme function and the element_rect element, users can easily customize the background color of both the entire plot and specific plot regions, allowing for more nuanced and visually appealing designs.
Changing the background color of plots enhances the visual presentation and facilitates better communication of data insights, whether using the foundational tools of base R or the advanced capabilities of ggplot2. The choice between these methods ultimately depends on the user’s specific requirements and the level of customization desired for their data visualizations in R.

Sheeraz is a Doctorate fellow in Computer Science at Northwestern Polytechnical University, Xian, China. He has 7 years of Software Development experience in AI, Web, Database, and Desktop technologies. He writes tutorials in Java, PHP, Python, GoLang, R, etc., to help beginners learn the field of Computer Science.
LinkedIn Facebook