How to Create a 3D Surface Plot From (x,y,z) Coordinates
- Understanding the Basics of 3D Surface Plots
- Interpolating Z Values for a 3D Surface Plot
- Visualizing the 3D Surface Plot
- Conclusion
- FAQ
Creating a 3D surface plot from (x, y, z) coordinates can be a challenging task, especially if you’re not familiar with visualization techniques. However, with the right tools and methods, you can easily transform a set of points into a stunning three-dimensional representation. This article will guide you through the process of estimating z values for a grid of x and y coordinates using interpolation, followed by a demonstration of how to visualize these points effectively.
Whether you’re working on data analysis, scientific research, or simply want to explore the beauty of 3D graphics, understanding how to create a surface plot is essential. We will focus on using Python, a powerful programming language that offers a variety of libraries for data visualization. By the end of this article, you’ll be equipped with the knowledge to create your own 3D surface plots effortlessly.
Understanding the Basics of 3D Surface Plots
Before diving into the methods for creating 3D surface plots, let’s clarify what a surface plot is. A surface plot is a three-dimensional representation of data points in a Cartesian coordinate system. The x and y coordinates define the position in the horizontal plane, while the z coordinate represents the height of the surface at that position. This visualization can help reveal patterns, trends, and relationships in the data that may not be immediately apparent in two-dimensional plots.
To create a 3D surface plot, you first need to have a set of (x, y, z) coordinates. These coordinates can be derived from experimental data, simulations, or any other source. However, often you may have only a sparse set of points, necessitating interpolation to estimate the z values for a complete grid of x and y coordinates. This article will walk you through the steps of interpolating these values and visualizing them using Python libraries like NumPy and Matplotlib.
Interpolating Z Values for a 3D Surface Plot
The first step in creating a 3D surface plot is to interpolate the z values for a grid of x and y coordinates. Interpolation is a mathematical technique used to estimate unknown values that fall within the range of known data points. In Python, the scipy.interpolate library provides several methods for performing interpolation, including grid-based methods that are particularly useful for creating surfaces.
Here’s how to interpolate z values from your (x, y, z) coordinates:
import numpy as np
from scipy.interpolate import griddata
import matplotlib.pyplot as plt

# Sample data points
x = np.array([0, 1, 2, 3, 4, 5])
y = np.array([0, 1, 2, 3, 4, 5])
z = np.array([0, 1, 4, 9, 16, 25])

# Create a grid of x and y values
xi = np.linspace(min(x), max(x), 100)
yi = np.linspace(min(y), max(y), 100)
xi, yi = np.meshgrid(xi, yi)

# Interpolate z values
zi = griddata((x, y), z, (xi, yi), method='cubic')

plt.figure(figsize=(10, 7))
plt.contourf(xi, yi, zi, levels=15, cmap='viridis')
plt.colorbar()
plt.title('Interpolated 3D Surface Plot')
plt.xlabel('X-axis')
plt.ylabel('Y-axis')
plt.show()
The code above demonstrates how to interpolate z values using the griddata function from the SciPy library. First, we define our known (x, y, z) coordinates. We then create a grid of x and y values using np.meshgrid, which generates a rectangular grid. The griddata function is called with the known points and the grid to estimate the z values using cubic interpolation.
The result is visualized using Matplotlib’s contourf function, which creates a filled contour plot. This gives a clear representation of how the z values change across the x and y grid.
Output:
A filled contour plot showing the interpolated z values over the defined grid.
This interpolation method is versatile and can handle various types of data, making it an excellent choice for generating smooth surfaces from sparse data points. Remember, the quality of the interpolation depends on the density and distribution of your original data points.
Visualizing the 3D Surface Plot
Once the z values have been interpolated, the next step is to visualize the 3D surface plot. For this purpose, we can use Matplotlib’s plot_surface function, which allows us to create a three-dimensional surface plot that effectively represents the data in a visually appealing way.
Here’s how you can visualize the interpolated z values:
from mpl_toolkits.mplot3d import Axes3D

fig = plt.figure(figsize=(10, 7))
ax = fig.add_subplot(111, projection='3d')
ax.plot_surface(xi, yi, zi, cmap='viridis')

ax.set_title('3D Surface Plot')
ax.set_xlabel('X-axis')
ax.set_ylabel('Y-axis')
ax.set_zlabel('Z-axis')
plt.show()
In this snippet, we first import the necessary module for 3D plotting. We create a new figure and add a 3D subplot. The plot_surface method is then called with the interpolated values, generating a smooth surface that represents the underlying data. The color map (cmap='viridis') enhances the visual appeal by providing a gradient effect based on the z values.
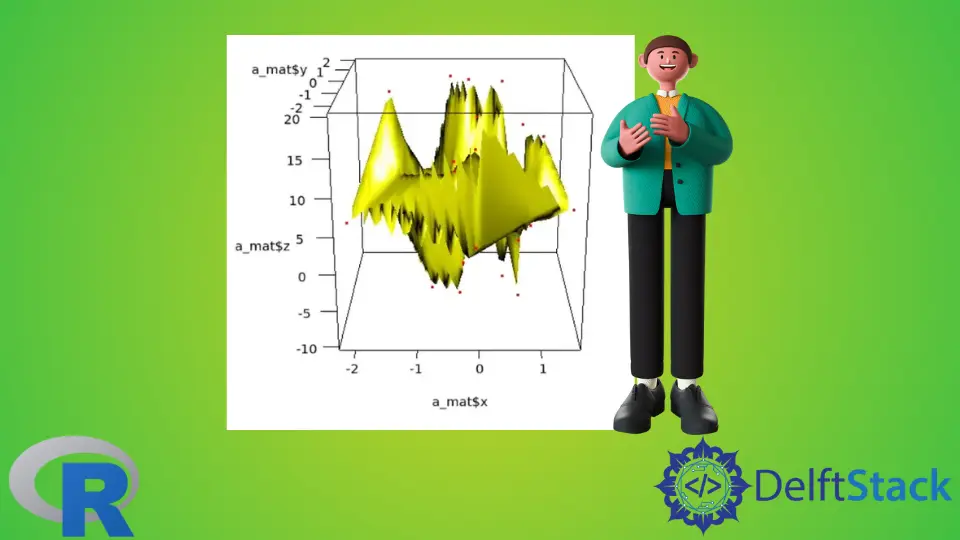
Output:
A 3D surface plot displaying the interpolated z values in a visually appealing manner.
This visualization technique allows you to explore the data from different angles and perspectives, providing insights that might not be visible in a two-dimensional representation. By adjusting the viewing angle and zoom level, you can better understand the relationships between the x, y, and z coordinates.
Conclusion
Creating a 3D surface plot from (x, y, z) coordinates is an essential skill for anyone working with data visualization. By employing interpolation techniques, you can estimate z values for a complete grid, allowing for a comprehensive representation of your data. With Python’s powerful libraries like NumPy, SciPy, and Matplotlib, the process becomes straightforward and accessible.
Whether you’re conducting scientific research, analyzing data trends, or simply exploring new ways to visualize information, mastering the art of 3D surface plotting will enhance your analytical capabilities. Now that you have the tools and knowledge at your disposal, it’s time to start creating your own stunning 3D visualizations.
FAQ
-
What is a 3D surface plot?
A 3D surface plot is a graphical representation of data points in three dimensions, where the x and y coordinates define the position on a horizontal plane and the z coordinate represents height. -
Why do I need interpolation for my data?
Interpolation is necessary when you have a sparse set of (x, y, z) coordinates and want to estimate z values for a complete grid, enabling a smoother surface representation. -
Which Python libraries are best for creating 3D surface plots?
The best Python libraries for creating 3D surface plots include Matplotlib for visualization and SciPy for interpolation. -
Can I customize the appearance of my 3D surface plot?
Yes, you can customize various aspects of your 3D surface plot, including color maps, view angles, and axis labels, to enhance visual appeal and clarity. -
Is it possible to save my 3D surface plot as an image?
Yes, you can save your 3D surface plot as an image file using Matplotlib’ssavefigfunction, allowing you to share or include it in reports.

Jesse is passionate about data analysis and visualization. He uses the R statistical programming language for all aspects of his work.