How to Create a 3D Perspective Plot in R

We can create a perspective plot of a surface using base R’s persp() function. The surface passes through the z values corresponding to all pairs of (x,y) values.
To use the persp() function, we need to understand the format of its main arguments. The rest of this article demonstrates and explains these with simple examples.
Arguments of the persp() Function in R
There are three arguments x, y and z for the 3 coordinates since persp() plots in 3 dimensions.
-
xandyare numeric vectors. These must be in ascending order. -
The argument
ztakes a matrix. There must be one value ofzin this matrix corresponding to each combination ofxandy.The surface that is plotted passes through all the
zvalues.
One way to create the matrix for z is to use the outer() function to apply a bivariate function to all combinations of x and y values.
By default, the persp() function shows the view from the negative side of the y-axis.
- The
phiargument gives the colatitude. Changingphifrom 0 to 90 degrees affects changing the view from the front to the top. - The
thetaargument gives the azimuth. Changingthetafrom 0 to 90 degrees has the effect of rotating the figure clockwise about its vertical axis.
Plot of a Plane Surface in R
We will now create two planes and view them from different angles. The first is a horizontal plane.
Example Code:
# A function that gives a constant z value.
H = function(x, y){
  return (0*x+0*y+1)
}

X = seq(-1,1,length.out=5)
Y = seq(-1,1, length.out=5)

# Apply the H function to all pairs (x,y).
# This gives the z matrix.
Z = outer(X, Y, H)

# Four different views.
persp(x=X,y=Y,z=Z, theta=0, phi=0, xlim=range(-2,2), ylim=range(-2,2), zlim=range(-2,2))
persp(x=X,y=Y,z=Z, theta=0, phi=45, xlim=range(-2,2), ylim=range(-2,2), zlim=range(-2,2))
persp(x=X,y=Y,z=Z, theta=0, phi=90, xlim=range(-2,2), ylim=range(-2,2), zlim=range(-2,2))
persp(x=X,y=Y,z=Z, theta=45, phi=45, xlim=range(-2,2), ylim=range(-2,2), zlim=range(-2,2))
Output figures:
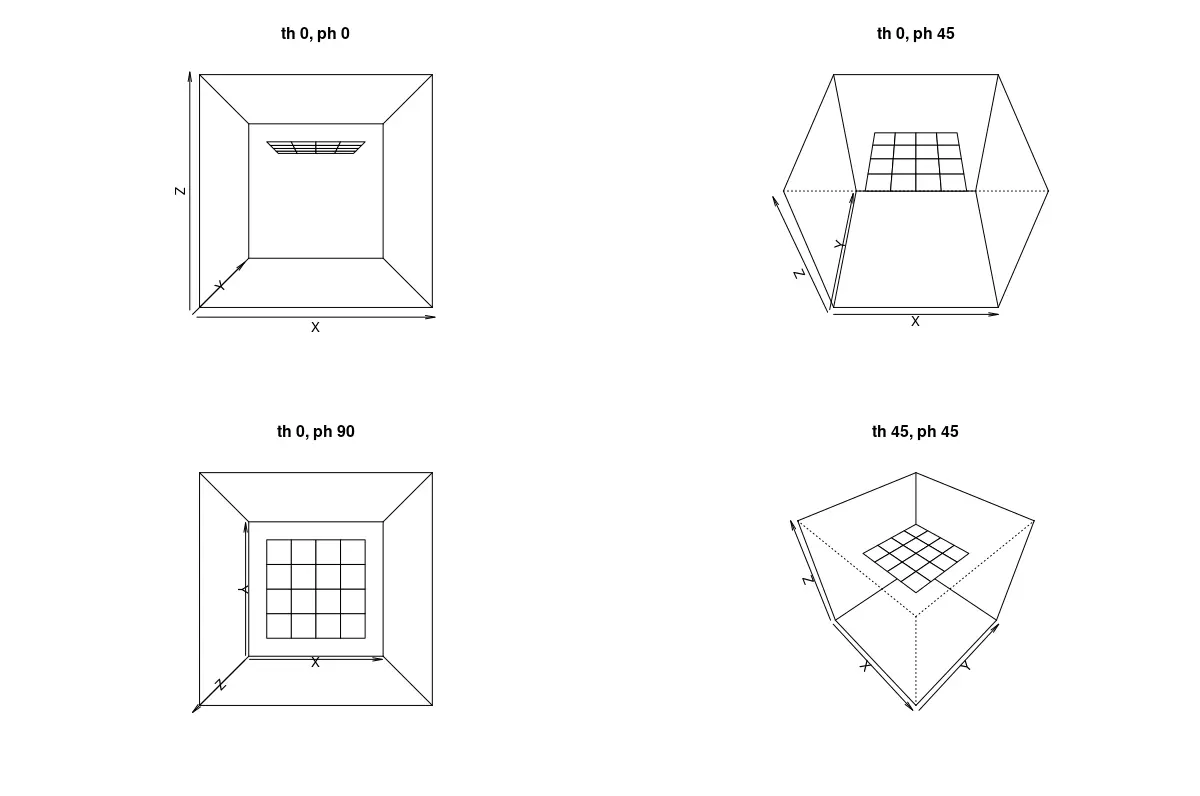
The four figures illustrate the effect of changing the angles theta and phi.
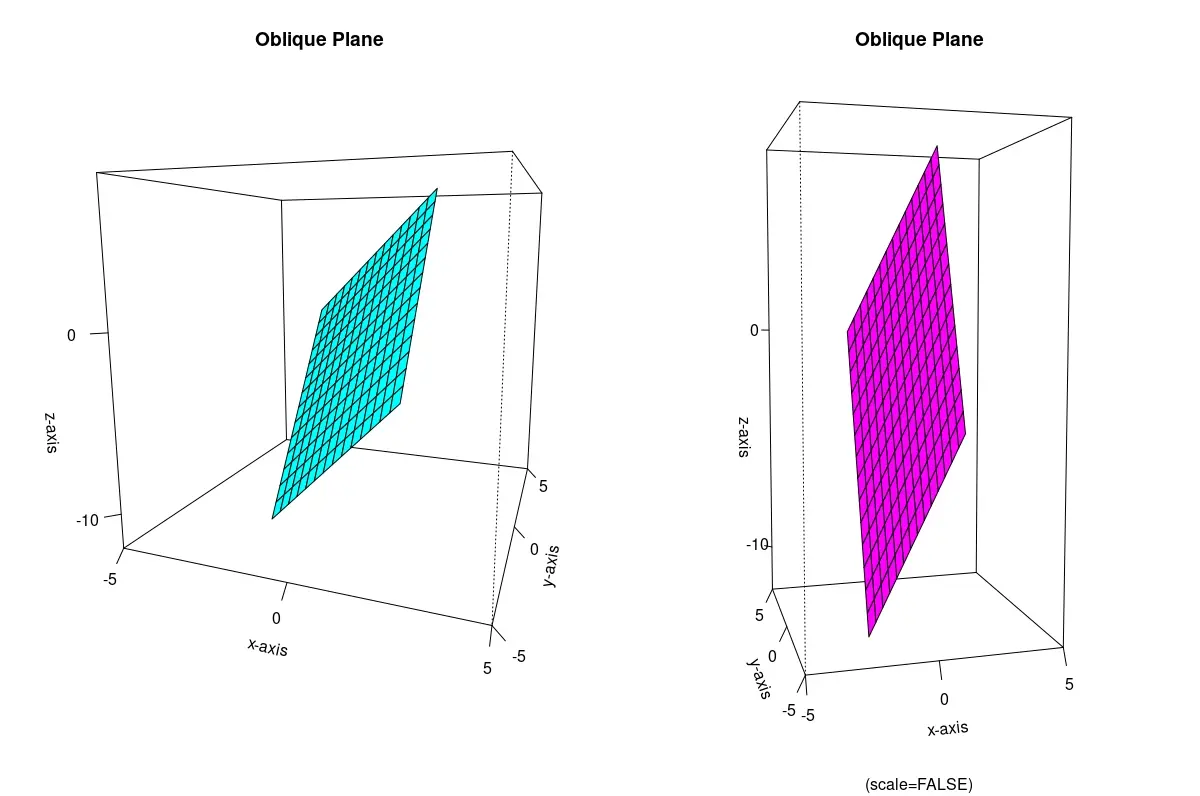
Next, we will look at an oblique plane. The syntax also illustrates setting other persp() function arguments.
Example Code:
# A function for a plane.
O = function(x, y){
  return (2*x+3*y-2)
}

X1 = seq(-2,2,length.out=15)
Y1 = seq(-2,2, length.out=15)

# Apply the function to all combinations of x and y.
Z1 = outer(X1, Y1, O)

# Check the range of the values of Z.
# This will help create the limits for the box.
range(Z1)

# Because we do not use the scale=FALSE argument, the output is a cube.
# The axes are scaled.
persp(x=X1,y=Y1,z=Z1, theta=20, phi=10, xlim=range(-5,5), ylim=range(-5,5), zlim=range(-12,8),
      xlab="x-axis",
      ylab="y-axis",
      zlab="z-axis",
      main="Oblique Plane",
      col="#00FFFF",
      ticktype="detailed",
      nticks=3)

# With scale=FALSE.
persp(x=X1,y=Y1,z=Z1, theta=-15, phi=5, xlim=range(-5,5), ylim=range(-5,5), zlim=range(-12,8),
      scale = FALSE,
      xlab="x-axis",
      ylab="y-axis",
      zlab="z-axis",
      main="Oblique Plane",
      col="#FF00FF",
      ticktype="detailed",
      nticks=3)
Output figures:
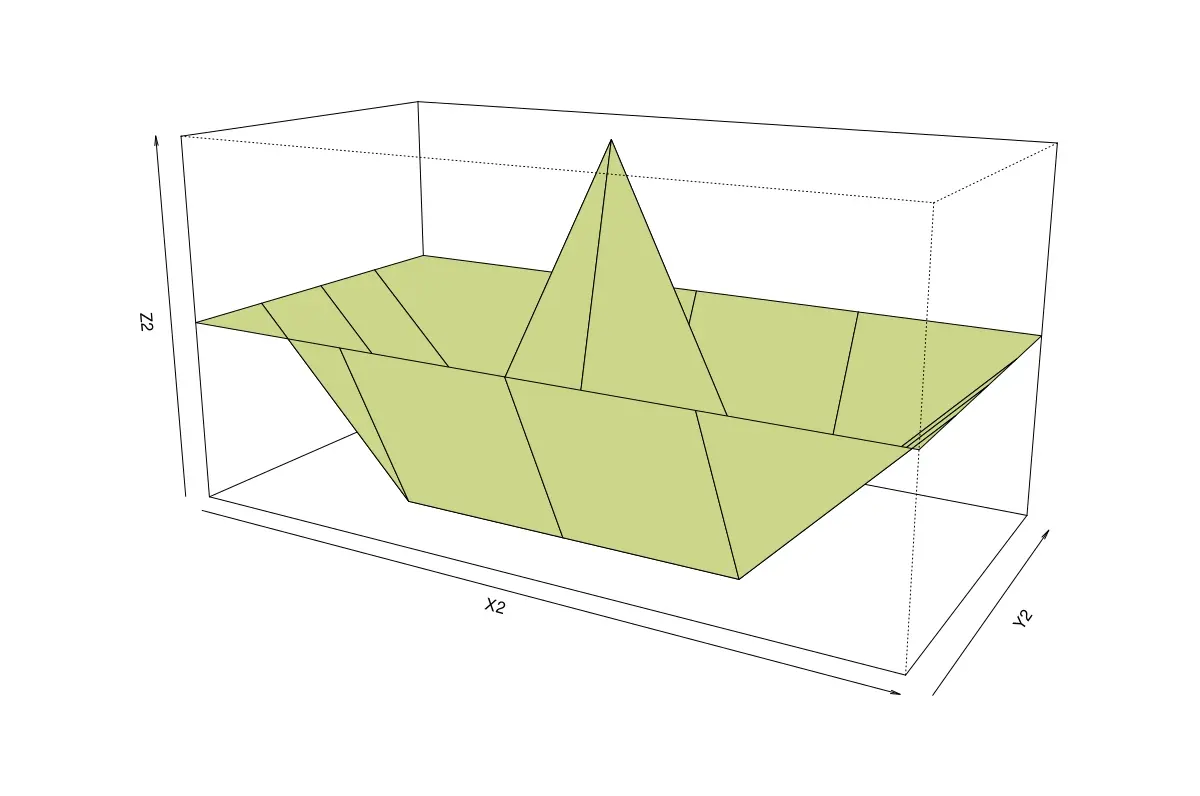
Plot from a Matrix in R
The persp() function can plot from a matrix of z values corresponding to vectors x and y in increasing order.
The number of rows and columns of z must match the lengths of x and y, respectively.
Example Code:
# Manually create a matrix of z values corresponding
# to all combinations of some x and y.
# (Or use such a pre-existing matrix.)
Z2 = matrix(data=c(1,1,1,1,1,
                  1,-1,-1,-1,1,
                  1,-1,3,-1,1,
                  1,-1,-1,-1,1,
                  1,1,1,1,1), ncol=5)

X2 = seq(-4, 4, length.out=5)
Y2 = seq(-2, 2, by=1)

persp(x=X2, y=Y2, z=Z2, scale=FALSE, col="#CBD68A", theta=30, phi=15)
Output figure:

Jesse is passionate about data analysis and visualization. He uses the R statistical programming language for all aspects of his work.