在 R 中创建 3D 透视图
Jesse John
2023年1月30日
R
R Plot

我们可以使用基础 R 的 persp() 函数创建曲面的透视图。曲面通过与所有 (x,y) 值对相对应的 z 值。
要使用 persp() 函数,我们需要了解其主要参数的格式。本文的其余部分通过简单的示例演示和解释这些。
R 中 persp() 函数的参数
由于 persp() 在 3 维中绘图,因此 3 个坐标有三个参数 x、y 和 z。
-
x和y是数值向量。这些必须按升序排列。 -
参数
z采用矩阵。该矩阵中必须有一个z值对应于x和y的每个组合。绘制的曲面通过所有
z值。
创建 z 矩阵的一种方法是使用 outer() 函数将二元函数应用于 x 和 y 值的所有组合。
默认情况下,persp() 函数从 y 轴的负侧显示视图。
phi参数给出了 colatitude。将phi从 0 度更改为 90 度会影响将视图从前面更改为顶部。theta参数给出方位角。将theta从 0 度更改为 90 度具有使图形绕其垂直轴顺时针旋转的效果。
R 中的平面图
我们现在将创建两个平面并从不同的角度查看它们。第一个是水平面。
示例代码:
# A function that gives a constant z value.
H = function(x, y){
  return (0*x+0*y+1)
}

X = seq(-1,1,length.out=5)
Y = seq(-1,1, length.out=5)

# Apply the H function to all pairs (x,y).
# This gives the z matrix.
Z = outer(X, Y, H)

# Four different views.
persp(x=X,y=Y,z=Z, theta=0, phi=0, xlim=range(-2,2), ylim=range(-2,2), zlim=range(-2,2))
persp(x=X,y=Y,z=Z, theta=0, phi=45, xlim=range(-2,2), ylim=range(-2,2), zlim=range(-2,2))
persp(x=X,y=Y,z=Z, theta=0, phi=90, xlim=range(-2,2), ylim=range(-2,2), zlim=range(-2,2))
persp(x=X,y=Y,z=Z, theta=45, phi=45, xlim=range(-2,2), ylim=range(-2,2), zlim=range(-2,2))
输出数字:
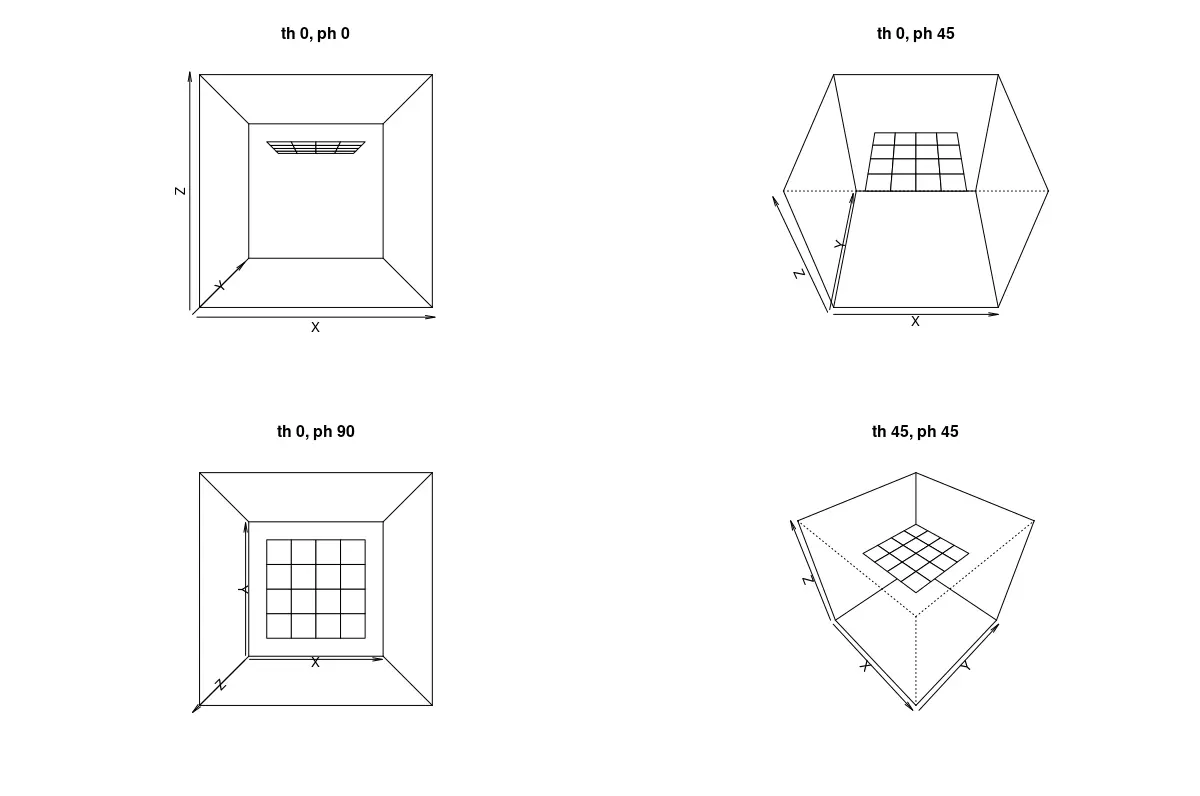
这四个图说明了改变角度 theta 和 phi 的效果。
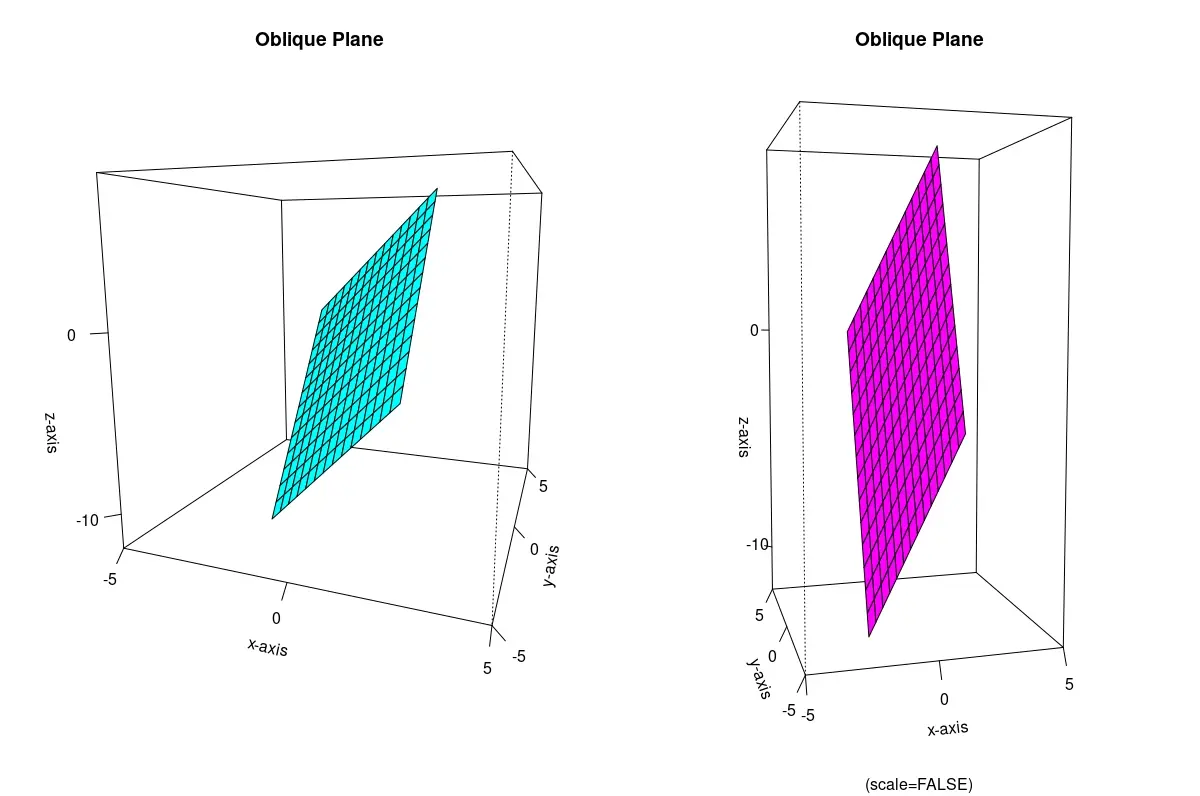
接下来,我们将看一个斜面。该语法还说明了设置其他 persp() 函数参数。
示例代码:
# A function for a plane.
O = function(x, y){
  return (2*x+3*y-2)
}

X1 = seq(-2,2,length.out=15)
Y1 = seq(-2,2, length.out=15)

# Apply the function to all combinations of x and y.
Z1 = outer(X1, Y1, O)

# Check the range of the values of Z.
# This will help create the limits for the box.
range(Z1)

# Because we do not use the scale=FALSE argument, the output is a cube.
# The axes are scaled.
persp(x=X1,y=Y1,z=Z1, theta=20, phi=10, xlim=range(-5,5), ylim=range(-5,5), zlim=range(-12,8),
      xlab="x-axis",
      ylab="y-axis",
      zlab="z-axis",
      main="Oblique Plane",
      col="#00FFFF",
      ticktype="detailed",
      nticks=3)

# With scale=FALSE.
persp(x=X1,y=Y1,z=Z1, theta=-15, phi=5, xlim=range(-5,5), ylim=range(-5,5), zlim=range(-12,8),
      scale = FALSE,
      xlab="x-axis",
      ylab="y-axis",
      zlab="z-axis",
      main="Oblique Plane",
      col="#FF00FF",
      ticktype="detailed",
      nticks=3)
输出数字:
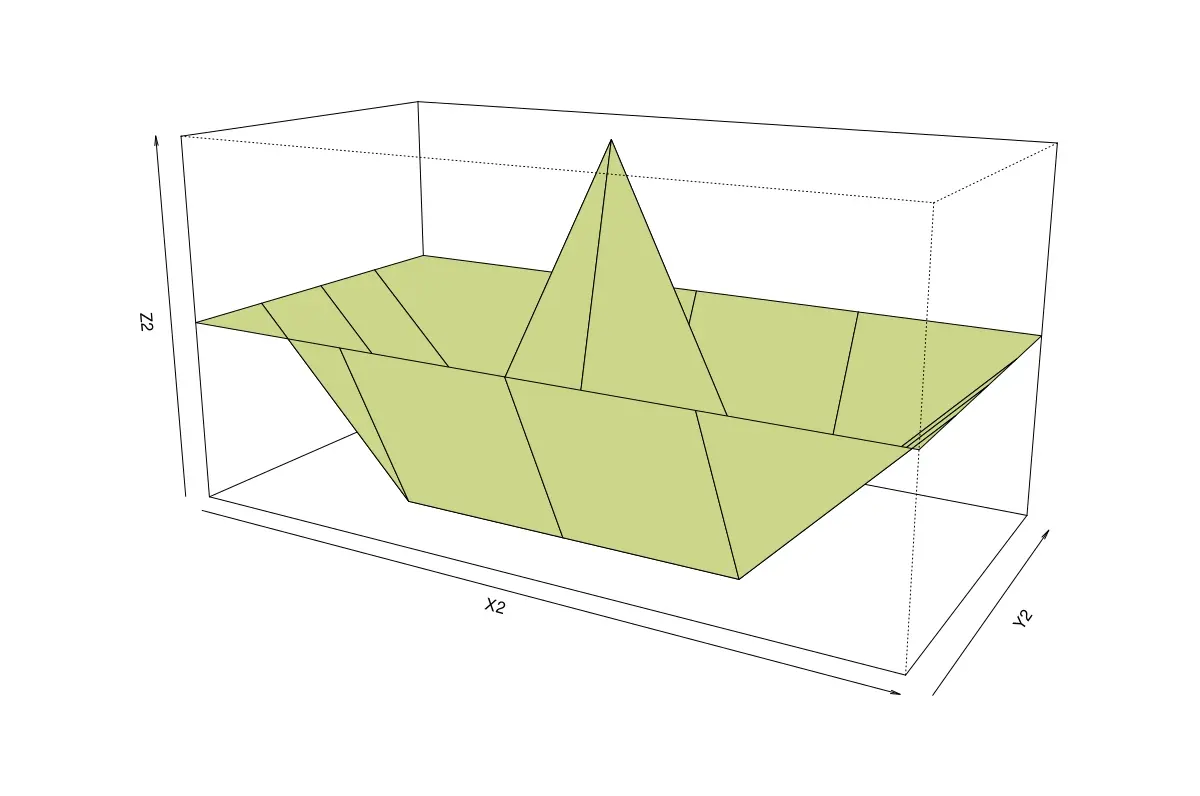
从 R 中的矩阵绘制
persp() 函数可以从对应于向量 x 和 y 的 z 值矩阵按升序绘制。
z 的行数和列数必须分别与 x 和 y 的长度匹配。
示例代码:
# Manually create a matrix of z values corresponding
# to all combinations of some x and y.
# (Or use such a pre-existing matrix.)
Z2 = matrix(data=c(1,1,1,1,1,
                  1,-1,-1,-1,1,
                  1,-1,3,-1,1,
                  1,-1,-1,-1,1,
                  1,1,1,1,1), ncol=5)

X2 = seq(-4, 4, length.out=5)
Y2 = seq(-2, 2, by=1)

persp(x=X2, y=Y2, z=Z2, scale=FALSE, col="#CBD68A", theta=30, phi=15)
输出图:
Enjoying our tutorials? Subscribe to DelftStack on YouTube to support us in creating more high-quality video guides. Subscribe
作者: Jesse John

Jesse is passionate about data analysis and visualization. He uses the R statistical programming language for all aspects of his work.