Base R 中的色盲无障碍颜色
Jesse John
2024年2月15日
R
R Plot
现在众所周知,与颜色相关的视力缺陷很常见。因此,我们需要在数据可视化中使用色盲可以接受的颜色。
本文展示了如何为此目的使用 base R 的内置调色板。
Base R 中的 Okabe-Ito 调色板
Base R 带有几个内置的调色板。可以使用命令 palette.pals() 查看调色板列表。
默认调色板是 R4。
内置调色板列表包括 Okabe-Ito 调色板。这已被确立为与颜色相关的视觉缺陷的合适调色板。
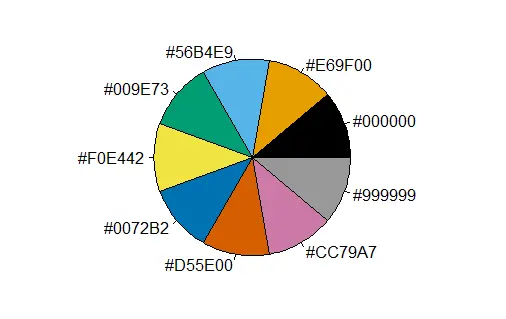
Okabe-Ito 调色板有九种颜色。我们可以使用 palette.colors() 函数查看颜色的名称。我们可以使用饼图可视化颜色。
示例代码:
# List the inbuilt color palettes.
palette.pals()

# List the colors in the Okabe-Ito palette.
palette.colors(NULL, "Okabe-Ito")

# Save the palette as a vector.
p = palette.colors(NULL, "Okabe-Ito")

# Visualize the colors.
# The order is anticlockwise, starting with black.
pie(rep(1, times=9), col=p, labels=p)
输出:
> # List the inbuilt color palettes.
> palette.pals()
 [1] "R3"              "R4"              "ggplot2"         "Okabe-Ito"
 [5] "Accent"          "Dark 2"          "Paired"          "Pastel 1"
 [9] "Pastel 2"        "Set 1"           "Set 2"           "Set 3"
[13] "Tableau 10"      "Classic Tableau" "Polychrome 36"   "Alphabet"
> # List the colors in the Okabe-Ito palette.
> palette.colors(NULL, "Okabe-Ito")
        black        orange       skyblue   bluishgreen        yellow          blue
    "#000000"     "#E69F00"     "#56B4E9"     "#009E73"     "#F0E442"     "#0072B2"
   vermillion reddishpurple          gray
    "#D55E00"     "#CC79A7"     "#999999"
在 Base R 中使用 Okabe-Ito 调色板的三种方法
使用 Okabe-Ito(或任何其他)调色板有三种方法。
- 使用
palette()函数更改 R 会话的调色板。 - 直接使用颜色而不改变会话调色板。
- 创建一个新调色板。我们可以使用现有调色板或多个调色板中的颜色,或任何其他颜色。
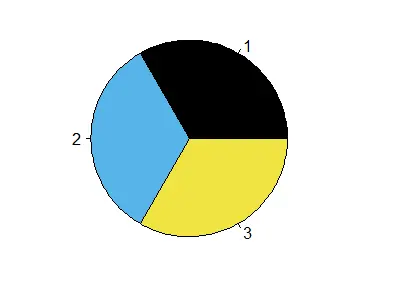
首先,我们将为 R 会话设置调色板。
示例代码:
# Set the Okabe-Ito palette for the session.
palette("Okabe-Ito")

# Get the palette colors.
palette() # We do not get the names.

# See the colors with the names.
palette.colors(NULL, "Okabe-Ito")

# Use its colors by index position.
# Make a pie chart with 3 sections using colors at positions 1, 3, 5.
pie(c(1,1,1), col=c(1,3,5))
输出:
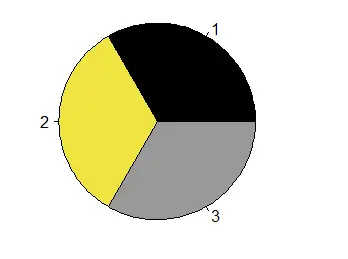
其次,我们将直接使用 Okabe-Ito 调色板。
示例代码:
# Reset the palette to the default, R4.
palette("default")

# We earlier saved the Okabe-Ito palette to a variable p.
p

# Make a pie chart using colors 1, 5 and 9 from this vector p.
pie(c(1,1,1), col=p[c(1,5,9)])
输出:
第三,我们将从 Okabe-Ito 调色板创建我们的调色板。这一次,我们将使用颜色代码。
我们可以使用这种技术从任何调色板或我们想要的任何其他颜色中选择颜色。
示例代码:
# View the Okabe-Ito palette.
p
# Create a character vector of four color codes.
ch = c("#000000", "#56B4E9", "#F0E442", "#CC79A7")
# We can use the colors from our vector by position.
# OR we can set our vector of color codes as the palette for the session.
pie(c(1,1,1), col=ch[1:3]) # Use by position.
palette(ch) # Set the palette.
palette() # View the palette.
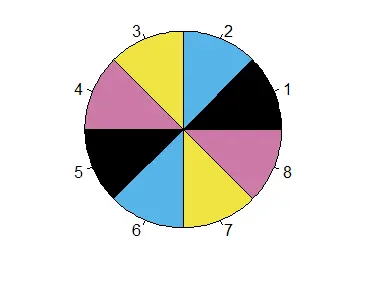
pie(c(1,1,1,1,1,1,1,1),col=palette()) # The colors are repeated in order.
输出:
参考
请参阅 R 项目关于 R 中的新调色板 的文章。此外,请参阅 palette 函数的文档。
Enjoying our tutorials? Subscribe to DelftStack on YouTube to support us in creating more high-quality video guides. Subscribe
作者: Jesse John

Jesse is passionate about data analysis and visualization. He uses the R statistical programming language for all aspects of his work.