Color-Blind Accessible Colors in Base R
It is now well known that color-related vision deficiencies are common. Therefore, we need to use colors that are color-blind accessible in our data visualizations.
This article shows how to use base R’s inbuilt palette for this purpose.
the Okabe-Ito Palette in Base R
Base R comes with several palettes built-in. The list of palettes can be seen with the command palette.pals().
The default palette is R4.
The list of inbuilt palettes includes the Okabe-Ito palette. This is well established as a suitable palette for color-related vision deficiencies.
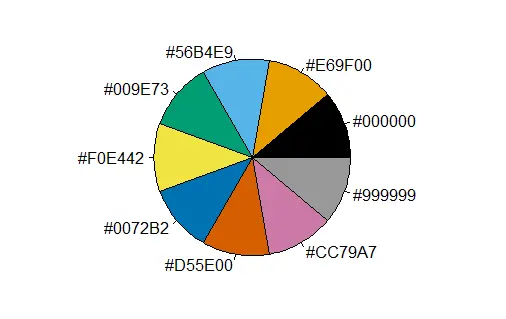
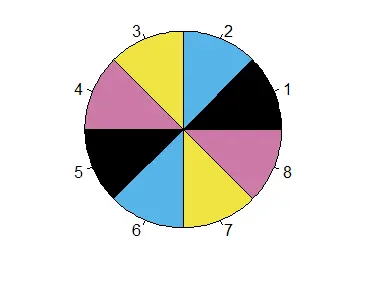
The Okabe-Ito palette has nine colors. We can see the names of the colors using the palette.colors() function. We can visualize the colors using a pie chart.
Example Code:
# List the inbuilt color palettes.
palette.pals()

# List the colors in the Okabe-Ito palette.
palette.colors(NULL, "Okabe-Ito")

# Save the palette as a vector.
p = palette.colors(NULL, "Okabe-Ito")

# Visualize the colors.
# The order is anticlockwise, starting with black.
pie(rep(1, times=9), col=p, labels=p)
Output:
> # List the inbuilt color palettes.
> palette.pals()
 [1] "R3"              "R4"              "ggplot2"         "Okabe-Ito"
 [5] "Accent"          "Dark 2"          "Paired"          "Pastel 1"
 [9] "Pastel 2"        "Set 1"           "Set 2"           "Set 3"
[13] "Tableau 10"      "Classic Tableau" "Polychrome 36"   "Alphabet"
> # List the colors in the Okabe-Ito palette.
> palette.colors(NULL, "Okabe-Ito")
        black        orange       skyblue   bluishgreen        yellow          blue
    "#000000"     "#E69F00"     "#56B4E9"     "#009E73"     "#F0E442"     "#0072B2"
   vermillion reddishpurple          gray
    "#D55E00"     "#CC79A7"     "#999999"
Three Ways to Use the Okabe-Ito Palette in Base R
There are three ways to use the Okabe-Ito (or any other) palette.
- Change the palette of the R session using the
palette()function. - Use the colors directly without changing the session palette.
- Create a new palette. We can use colors from an existing palette or multiple palettes, or any other colors.
First, we will set the color palette for the R session.
Example Code:
# Set the Okabe-Ito palette for the session.
palette("Okabe-Ito")
# Get the palette colors.
palette() # We do not get the names.
# See the colors with the names.
palette.colors(NULL, "Okabe-Ito")
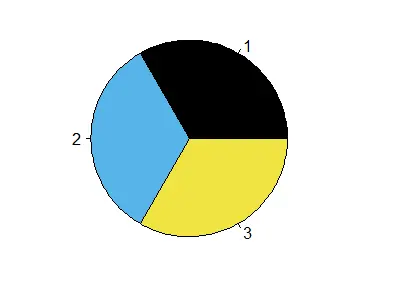
# Use its colors by index position.
# Make a pie chart with 3 sections using colors at positions 1, 3, 5.
pie(c(1,1,1), col=c(1,3,5))
Output:
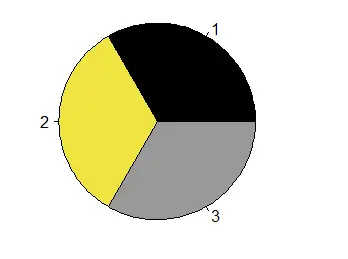
Second, we will use the Okabe-Ito palette directly.
Example Code:
# Reset the palette to the default, R4.
palette("default")

# We earlier saved the Okabe-Ito palette to a variable p.
p

# Make a pie chart using colors 1, 5 and 9 from this vector p.
pie(c(1,1,1), col=p[c(1,5,9)])
Output:
Third, we will create our palette from the Okabe-Ito palette. This time, we will use color codes.
We can use this technique to choose colors from any palette or any other colors that we want.
Example Code:
# View the Okabe-Ito palette.
p

# Create a character vector of four color codes.
ch = c("#000000", "#56B4E9", "#F0E442", "#CC79A7")

# We can use the colors from our vector by position.
# OR we can set our vector of color codes as the palette for the session.
pie(c(1,1,1), col=ch[1:3]) # Use by position.

palette(ch) # Set the palette.
palette() # View the palette.
pie(c(1,1,1,1,1,1,1,1),col=palette()) # The colors are repeated in order.
Output:
References
See the R Project’s article on the new palettes in R. Also, see the documentation of the palette function.

Jesse is passionate about data analysis and visualization. He uses the R statistical programming language for all aspects of his work.