How to Create a Ggplot2 Visualization With a Transparent Background
This tutorial demonstrates how to create a ggplot2 visualization with a transparent background and export it to a .png file using the ggsave() function.
Create a Visualization With a Transparent Background
To create a ggplot2 visualization with a transparent background, we need to set the value of two theme elements, panel.background and plot.background.
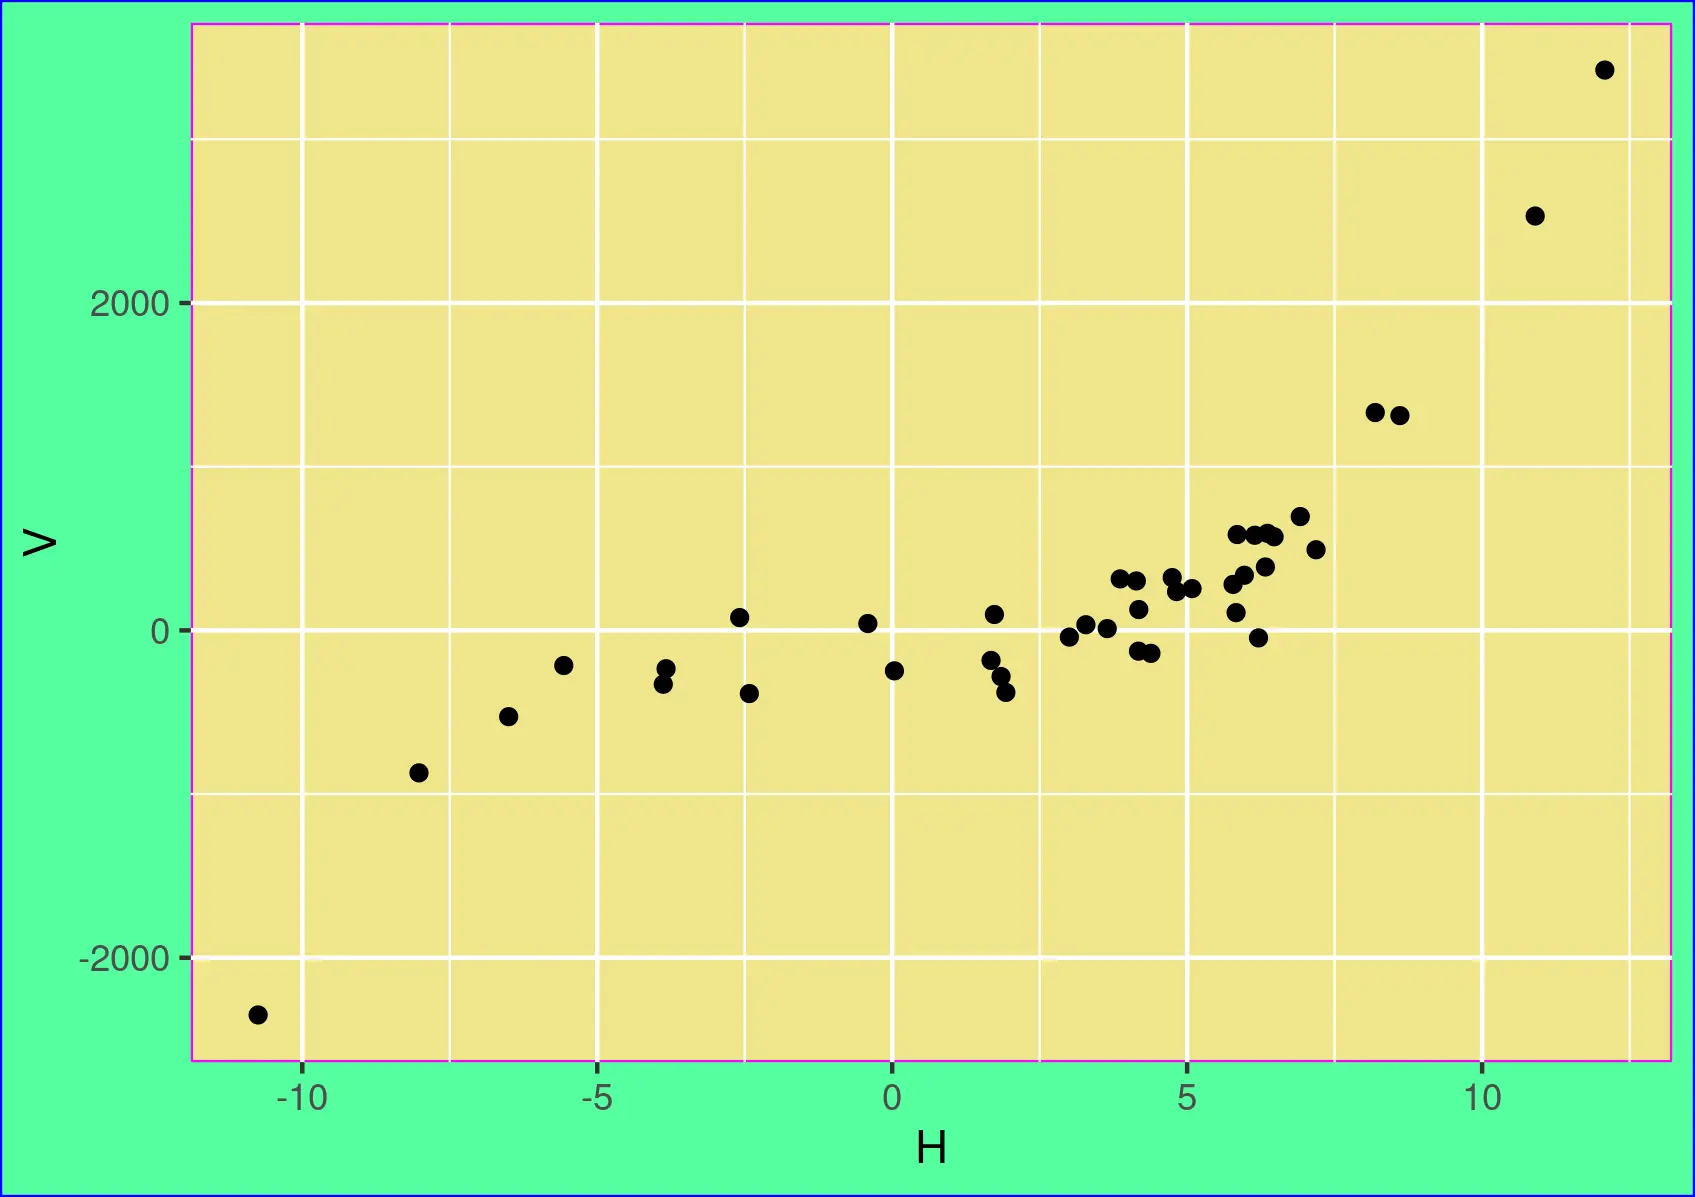
We need to set their fill and color properties to NA using the element_rect() function, as shown in the sample code. The first plot shows the difference between the two backgrounds.
The second plot has a transparent background because the fill and color properties of both backgrounds’ are set to NA.
Example Code:
# First, we'll create some sample data.
set.seed(5445)
H = rnorm(40, 2, 5)
set.seed(4554)
V = 2*H**3 + rnorm(40, 0, 200)
dafr = data.frame(H,V)

# Install the ggplot2 if it is not available.
# Uncomment and run the following line to install.
# install.packages("ggplot2")

# Load the ggplot2 package.
library(ggplot2)

# See the panel and plot backgrounds.
ggplot(data=dafr, aes(x=H, y=V)) + geom_point() +
  theme(panel.background = element_rect(fill="khaki", color="magenta"),
        plot.background = element_rect(fill="seagreen1", color="blue"))

# Create a plot with a transparent background.
# Set both backgrounds to NA. Also, set the border colours to NA.
ggplot(data=dafr, aes(x=H, y=V)) + geom_point() +
  theme(panel.background = element_rect(fill=NA, color=NA),
        plot.background = element_rect(fill=NA, color=NA))
Output:
The two backgrounds:
Image with transparent background:
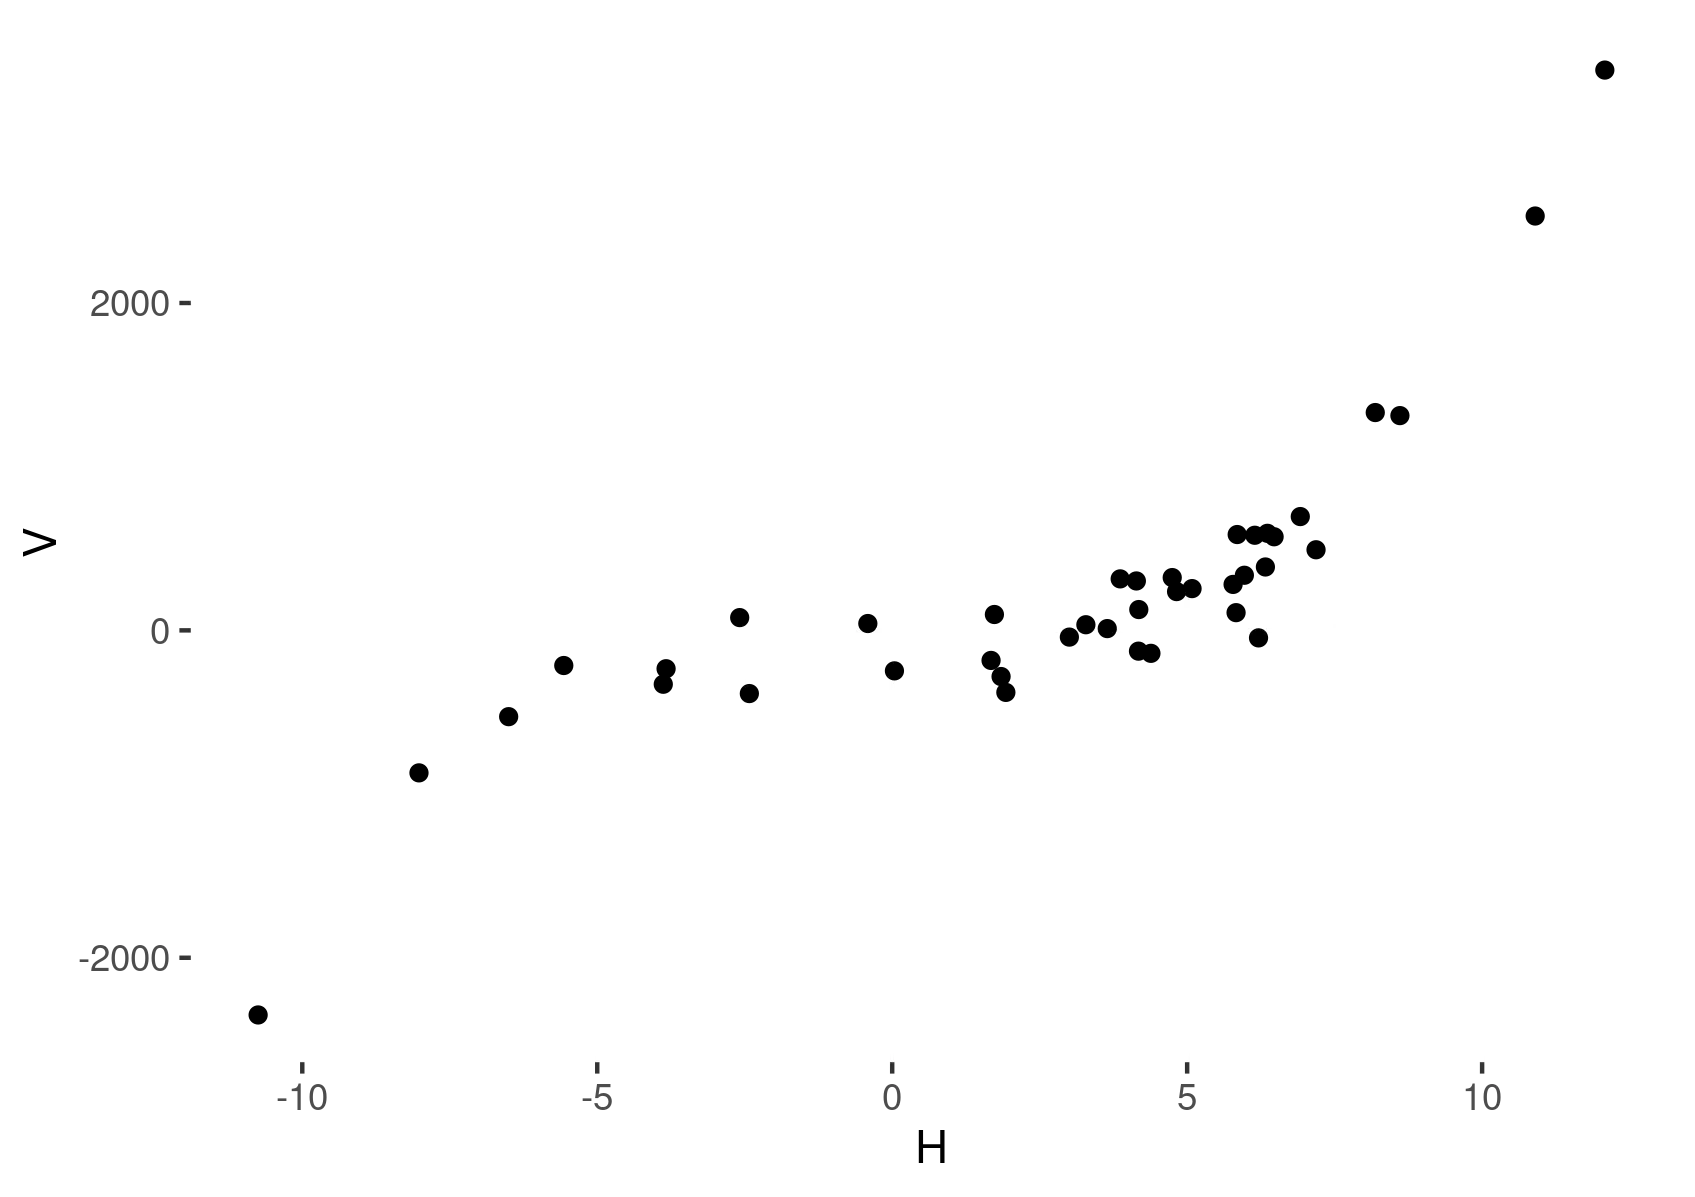
We cannot see the image’s axis lines and grid lines against a white page background because these lines are white in ggplot2’s default theme.
We can set the axis and grid lines to the desired colours using the theme properties axis.line, panel.grid.major and panel.grid.minor. The colours are set using the element_line() function, as shown below.
Example Code:
ggplot(data=dafr, aes(x=H, y=V)) + geom_point() +
  theme(panel.background = element_rect(fill=NA, color=NA),
        plot.background = element_rect(fill=NA, color=NA),
        axis.line = element_line(color="black"),
        panel.grid.major = element_line(colour = "gray50"),
        panel.grid.minor = element_line(color = "gray70"))
Output:
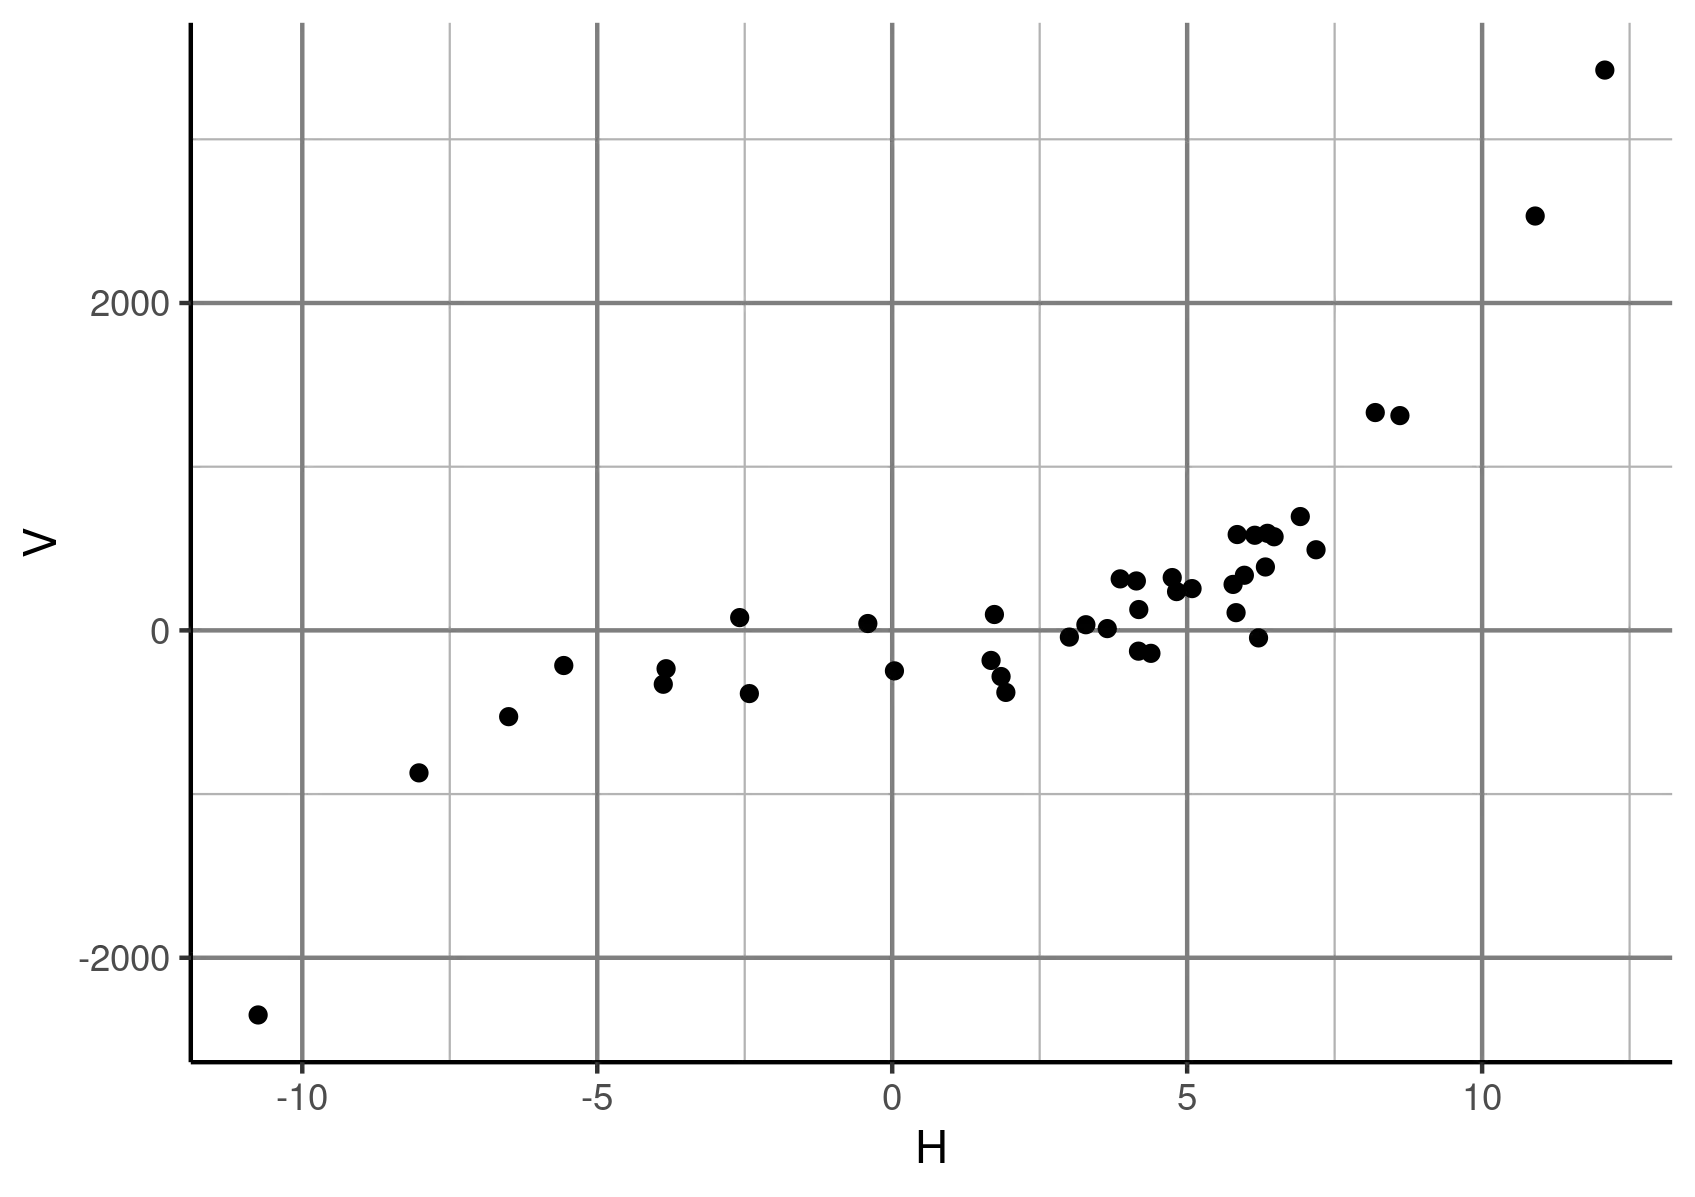
We can now see the axis and the grid lines on a transparent background.
Export the Visualization to a PNG File
To export the visualization to a PNG file, we will use the ggsave() function of ggplot2. First, give the file name the .png extension to create a PNG file. Then, the command saves the last displayed plot to a file.
The file path defaults to R’s working directory. The ggsave() function has options to control the size and resolution of the generated image.
Example Code:
ggsave("ggplotTransparentBGSampleImage.png")
Output:
It will save a file named ggplotTransparentBGSampleImage.png to R’s working directory.

Jesse is passionate about data analysis and visualization. He uses the R statistical programming language for all aspects of his work.