Rで背景色をプロットする
プロットの背景色は、R の要件に基づいて変更できます。このチュートリアルでは、R でプロットの背景色を変更する方法を示します。
ベース R で背景色をプロットする
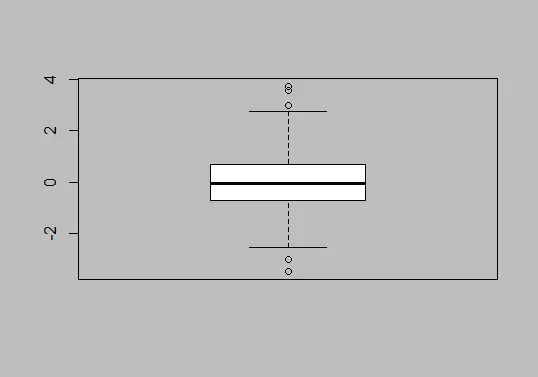
base R の背景色を変更するには、par(bg ="")を使用します。例を試してみましょう。
Demo <- rnorm(1000)

# grey background color
par(bg = "grey")

# plot the graph
boxplot(Demo, col = "White")
上記のコードは par を使用して、R のプロットの背景色を変更しました。デフォルトの色は 白 です。
グレーに変更しました。 出力プロットを参照してください:
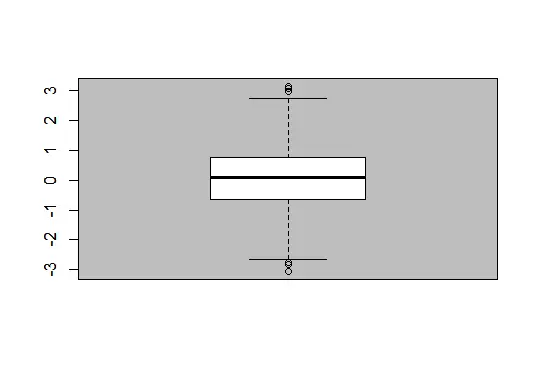
ご覧のとおり、プロット全体の背景色が変わります。 プロット領域の背景色を変更するには、次を使用します。
Demo <- rnorm(1000)

# the basic plot
boxplot(Demo)

# the plot region color
rect(par("usr")[1], par("usr")[3],
     par("usr")[2], par("usr")[4],
     col = "grey")

# adding the new plot
par(new = TRUE)

# Create final plot
boxplot(Demo, col = "white")
このコードは、グラフの領域を選択し、背景色を変更します。 出力を参照してください:
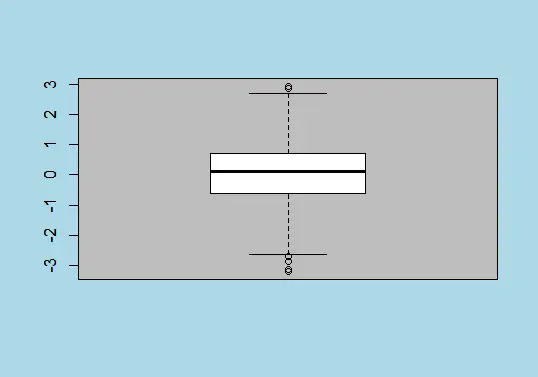
最後に、背景色とプロット エリアの色を異なる方法で変更することもできます。 例を参照してください:
Demo <- rnorm(1000)

# Whole background color
par(bg = "lightblue")

# the basic plot
boxplot(Demo)

# the plot region color
rect(par("usr")[1], par("usr")[3],
     par("usr")[2], par("usr")[4],
     col = "grey")

# adding the new plot
par(new = TRUE)

# Create final plot
boxplot(Demo, col = "white")
上記のコードは、プロットに 2つの色を追加します。 1つは全体の背景色で、もう 1つはプロット領域の背景色です。 出力を参照してください:
Rのggplot2で背景色をプロットする
ggplot2 は R でグラフをプロットするためのライブラリです。まず ggplot2 でデモ グラフをプロットしてから、背景色を変更してみましょう。
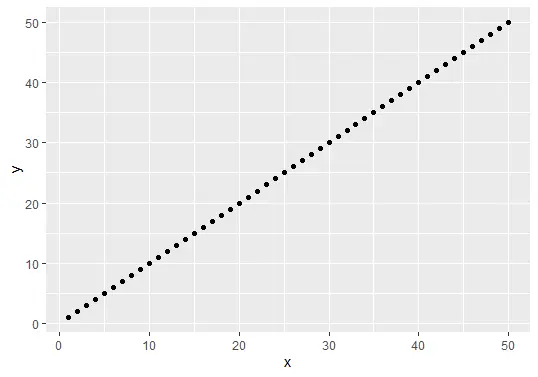
まず、ggplot2 ライブラリをロードしてグラフをプロットします。
library("ggplot2")

# Create demo data
demo_data <- data.frame(x = 1:50, y = 1:50)

# plot with ggplot2
ggplot(demo_data, aes(x, y)) + geom_point()
上記のコードは、出力に示されているデフォルトのグラフを作成します。 ここで、背景色を変更してみます。
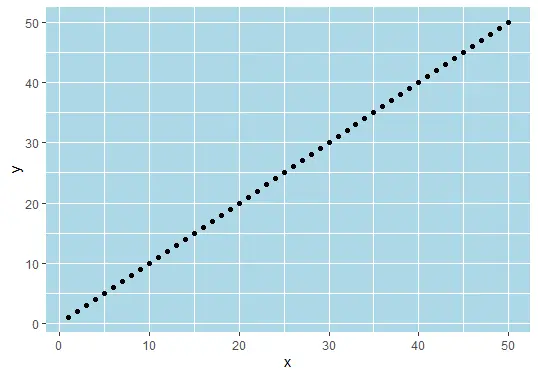
上のグラフのプロット領域の背景色を変更してみましょう。 例を参照してください:
library("ggplot2")

# Create demo data
demo_data <- data.frame(x = 1:50, y = 1:50)

# plot with ggplot2
ggplot(demo_data, aes(x, y)) +
  geom_point()+
  theme(panel.background = element_rect(fill = "lightblue" ))
上記のコードは、グラフ領域の背景色を水色に変更します。 出力を参照してください:
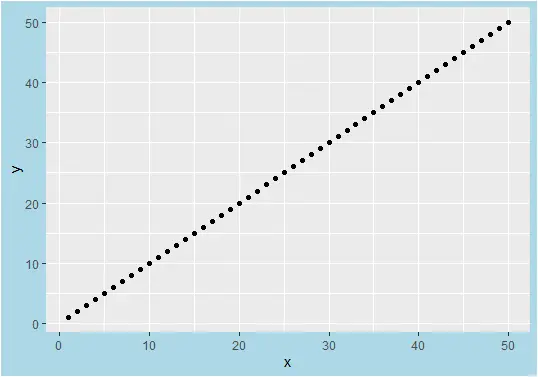
最後に、さまざまな背景色とデフォルトのプロット領域の色を試してみましょう。 例を参照してください:
library("ggplot2")

# Create demo data
demo_data <- data.frame(x = 1:50, y = 1:50)

# plot with ggplot2
ggplot(demo_data, aes(x, y)) +
  geom_point()+
  theme(plot.background = element_rect(fill = "lightblue" ))
上記のコードは、プロット領域ではなく、グラフの背景色のみを変更します。 出力を参照してください:

Sheeraz is a Doctorate fellow in Computer Science at Northwestern Polytechnical University, Xian, China. He has 7 years of Software Development experience in AI, Web, Database, and Desktop technologies. He writes tutorials in Java, PHP, Python, GoLang, R, etc., to help beginners learn the field of Computer Science.
LinkedIn Facebook