R の Ggplot2 に信頼区間を追加する
ggplot2 ライブラリは、さまざまなグラフをプロットするために使用されます。 geom_smooth() または geom_ribbon() メソッドを使用して、信頼区間の線またはバンドをプロットに追加できます。
このチュートリアルでは、R で ggplot2 に信頼区間を追加する方法を示します。
R の ggplot2 に信頼区間を追加する
まず、ggplot2 をプロットするデータ フレームを作成する必要があります。
コード例:
x <- 1:80
y <- rnorm(80) + x / 8
low <- y + rnorm(80, - 2, 0.1)
high <- y + rnorm(80, + 2, 0.1)
data_frame <- data.frame(x, y, low, high)
head(data_frame)
上記のコードは、80 行と 4 列のサンプル データ フレームを作成します。 x と y はプロットされる値で、値 high と low はそれらの値の信頼区間です。
データ フレームの先頭であるコードの出力を参照してください。
  x          y         low     high
1 1  0.7819640 -1.29439898 2.719669
2 2  0.8893052 -1.09524369 2.885744
3 3  1.8762126  0.03061524 3.910596
4 4 -0.3713966 -2.34534103 1.683949
5 5  1.9099850 -0.04985367 4.026922
6 6  1.2793110 -0.82542732 3.199673
次のステップは、ggplot2 をプロットすることです。 しかし、まず、ggplot2 パッケージをインストールしてロードする必要があります。
install.packages("ggplot2")
library("ggplot2")
パッケージが読み込まれると、ggplot をプロットできます。
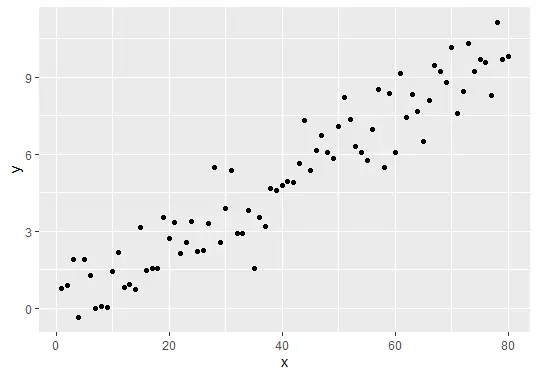
gg_plot <- ggplot(data_frame, aes(x, y)) +
  geom_point()
gg_plot
上記のコードは、グラフをプロットします。
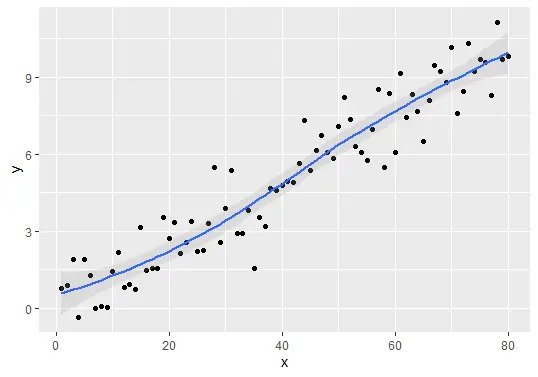
geom_smooth() または geom_ribbon() メソッドを使用して、最終的に信頼区間を ggplot2 に追加できます。
geom_smooth() メソッドを使用して信頼区間の線を追加します。
## Add confidence interval lines
gg_plot + geom_smooth(aes(ymin = low, ymax = high), alpha = 0.2)
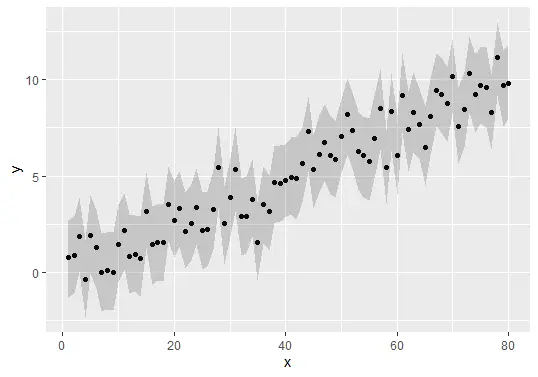
geom_ribbon() メソッドを使用して信頼区間バンドを追加します。
完全なサンプルコード
このチュートリアルで使用する完全なサンプル コードを次に示します。
x <- 1:80
y <- rnorm(80) + x / 8
low <- y + rnorm(80, - 2, 0.1)
high <- y + rnorm(80, + 2, 0.1)
data_frame <- data.frame(x, y, low, high)
head(data_frame)

install.packages("ggplot2")
library("ggplot2")

gg_plot <- ggplot(data_frame, aes(x, y)) +
  geom_point()
gg_plot

## Add confidence interval lines
gg_plot + geom_smooth(aes(ymin = low, ymax = high), alpha = 0.2)

## Add confidence interval bands
gg_plot + geom_ribbon(aes(ymin = low, ymax = high), alpha = 0.2)

Sheeraz is a Doctorate fellow in Computer Science at Northwestern Polytechnical University, Xian, China. He has 7 years of Software Development experience in AI, Web, Database, and Desktop technologies. He writes tutorials in Java, PHP, Python, GoLang, R, etc., to help beginners learn the field of Computer Science.
LinkedIn Facebook