R ggplot2 플롯에서 축 제한을 설정하는 방법
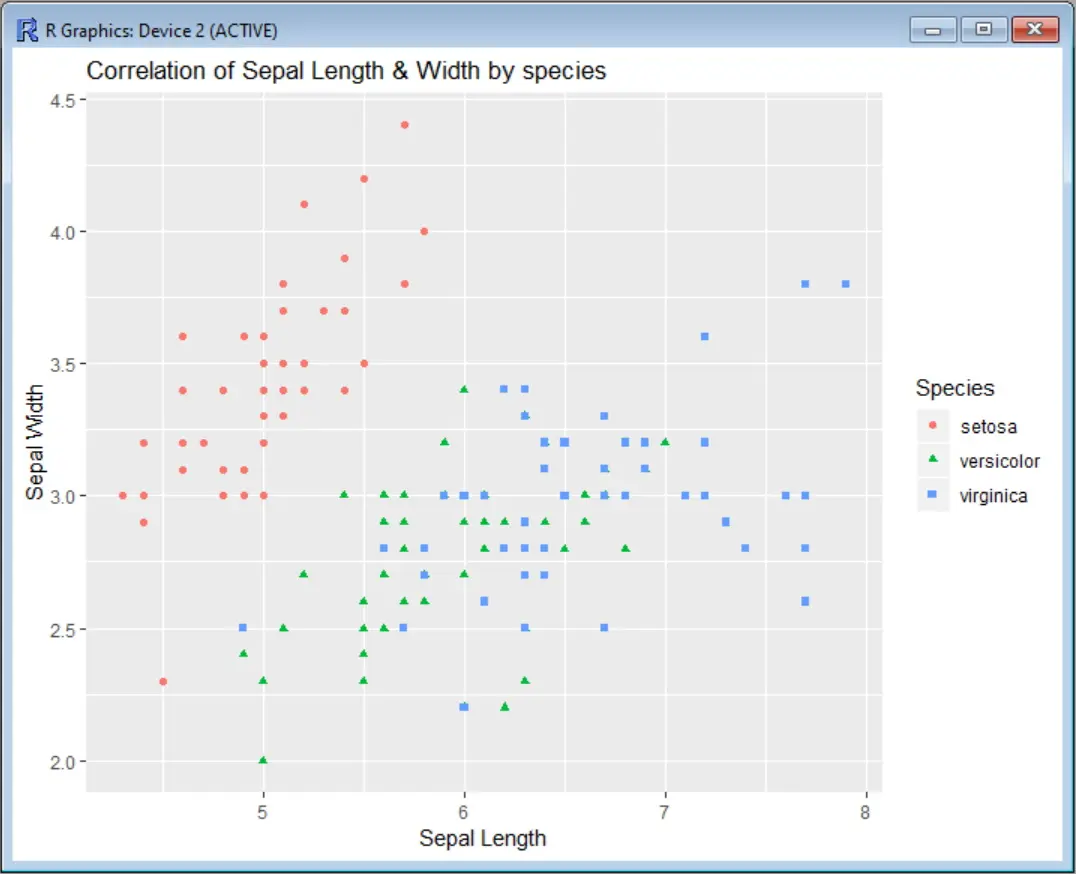
먼저 축에 제한을 두지 않고 산점도를 보겠습니다. 이 예에서는 Iris 데이터 세트를 사용하여 꽃받침 너비 값과 꽃받침 너비를 상관시켜 종을 색상별로 분류합니다. ggplot 함수를 호출하기 전에ggplot2 패키지를 설치하고 해당 라이브러리를로드해야합니다.
install.packages("ggplot2")
library(ggplot2)
scatter <- ggplot(data=iris, aes(x = Sepal.Length, y = Sepal.Width))
scatter + geom_point(aes(color=Species, shape=Species)) +
 ylab("Sepal Width") + xlab("Sepal Length") +
 ggtitle("Correlation of Sepal Length & Width by species")
출력:
이제 플롯이x=5와x=7 사이의 영역 만 표시하도록 x 축 (Sepal Length)을 제한한다고 가정합니다. 이를위한 두 가지 옵션이 있습니다.scale_x_continuous 사용 또는coord_cartesian 사용.
scale_x_continuous는 주어진 축에 대해 지정된 범위를 벗어나는 모든 데이터 포인트를 제거하는 반면coord_cartesian은 가시 영역 만 조정합니다. 대부분의 경우 두 옵션 모두 동일한 결과를 렌더링합니다. 그러나 데이터에 무언가를 맞추면 적합치가 변경 될 것입니다.
ggplot2에서scale_x_continuous로 x 축 제한 설정
scale_x_continuous를 사용하려면 다음과 같이 x 축의 하한과 상한이있는 벡터를 지정해야합니다.
scatter <- ggplot(data=iris, aes(x = Sepal.Length, y = Sepal.Width))
scatter + geom_point(aes(color=Species, shape=Species)) +
 ylab("Sepal Width") + xlab("Sepal Length") +
 ggtitle("Correlation of Sepal Length & Width by species") +
 scale_x_continuous(limits = c(5, 7))
출력:
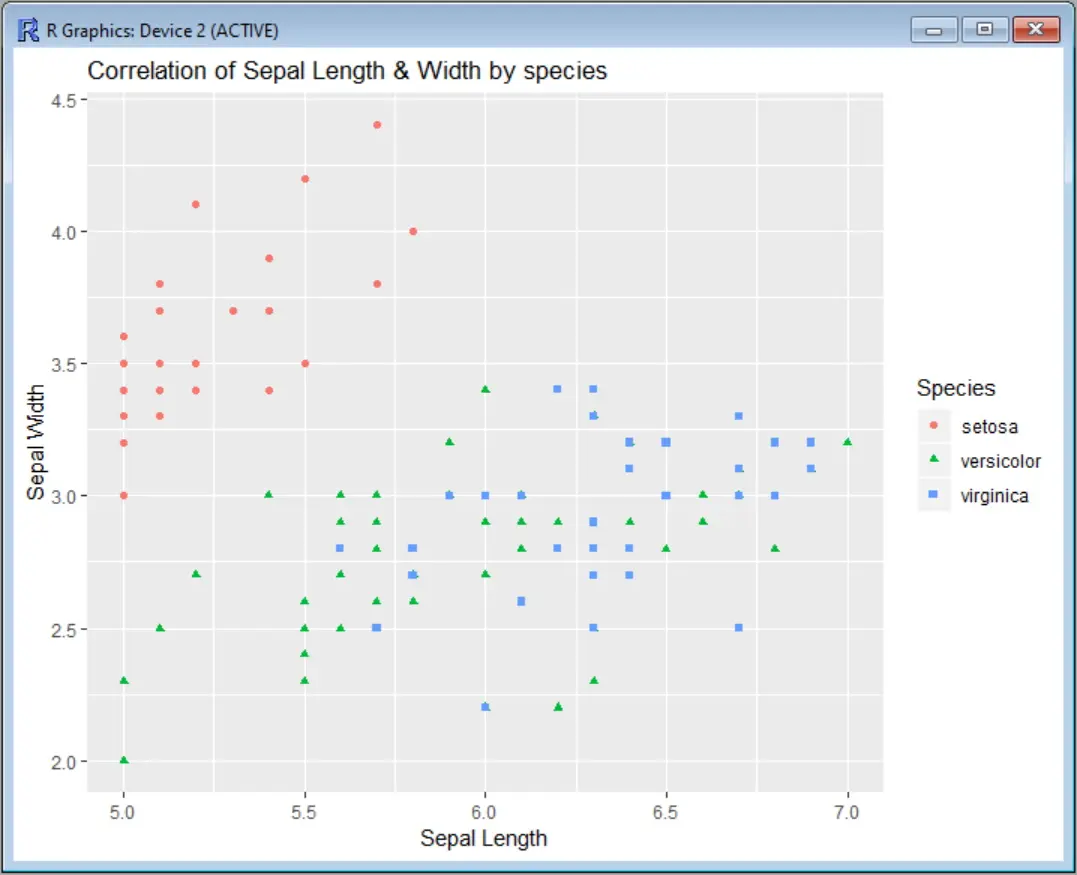
또한 그래프에서 제거 된 데이터 포인트 수를 알려주는 경고 메시지가 표시됩니다.
Warning message:
Removed 34 rows containing missing values (geom_point).
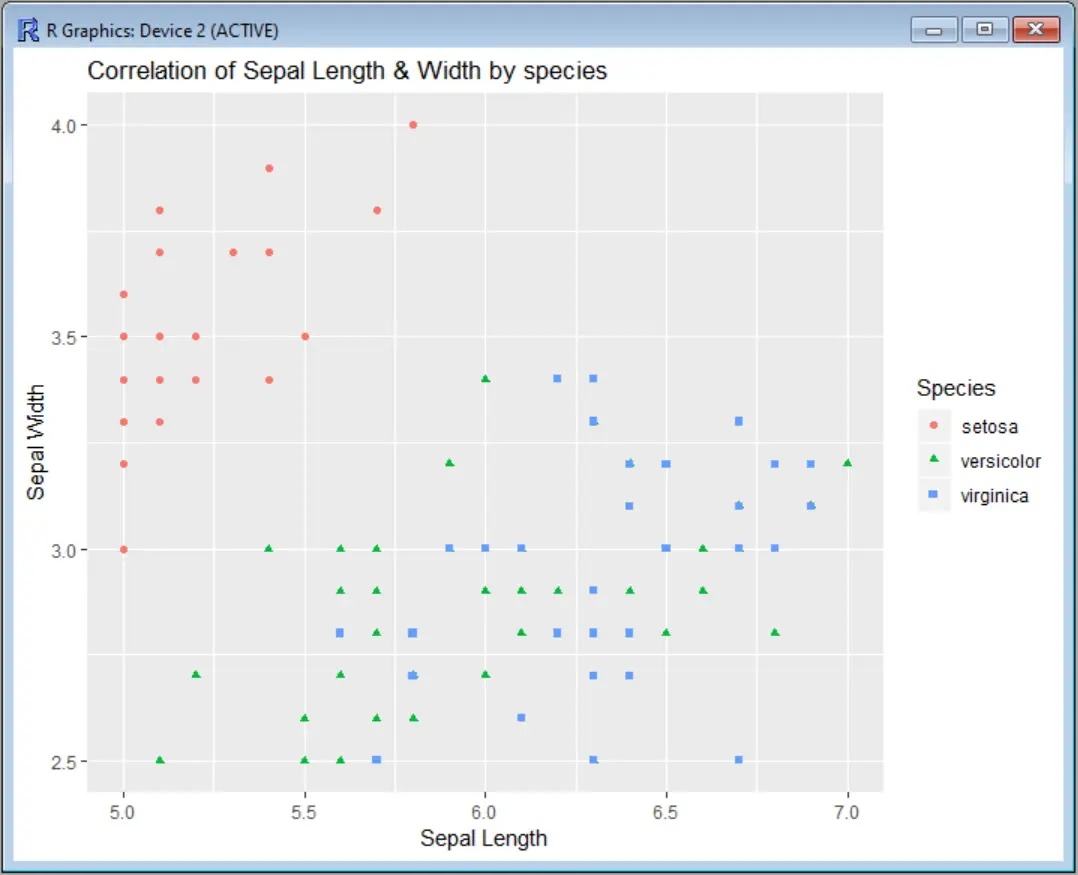
y 축도 제한하려는 경우 다음 예에서와 같은 방식으로scale_y_continuous를 추가 할 수 있습니다.
scatter-<--ggplot(data=iris,-aes(x-=-Sepal.Length,-y-=-Sepal.Width))
scatter + geom_point(aes(color=Species, shape=Species)) +
ylab("Sepal Width") + xlab("Sepal Length") +
ggtitle("Correlation of Sepal Length & Width by species") +
scale_x_continuous(limits = c(5, 7)) +
scale_y_continuous(limits = c(2.5, 4))
출력은 두 축의 한계를 표시합니다.
scale_x_continuous 및scale_y_continuous 대신 단축 함수xlim 및ylim을 사용하여 명령을 조금 더 짧게 만들 수도 있습니다.
scatter <- ggplot(data=iris, aes(x = Sepal.Length, y = Sepal.Width))
scatter + geom_point(aes(color=Species, shape=Species)) +
  ylab("Sepal Width") + xlab("Sepal Length") +
  ggtitle("Correlation of Sepal Length & Width by species") +
  xlim(5, 7) + ylim(2.5, 4)
ggplot2에서 두 축을 제한하려면coord_cartesian을 사용하세요
scale_x_continuous 및scale_y_continuous 대신coord_cartesian을 사용하려는 경우 명령은 다음과 같습니다.
scatter <- ggplot(data=iris, aes(x = Sepal.Length, y = Sepal.Width))
scatter + geom_point(aes(color=Species, shape=Species)) +
 ylab("Sepal Width") + xlab("Sepal Length") +
 ggtitle("Correlation of Sepal Length & Width by species") +
 coord_cartesian(xlim = c(5, 7), ylim = c(2.5, 4))
그리고 플롯 출력은 동일합니다.
RStudio ggplot2 치트 시트에서이 명령에 대한 모든 옵션 사용에 대한 시각적 설명을 찾을 수 있습니다.