How to Set Thickness of Plots in R
- Set the Thickness of Plot Lines
- Set the Thickness of the Axes
- Set the Thickness of the Borders
- Conclusion
R programming is considered one of the most useful and widely used programming languages for data and statistical analysis. One essential feature for carrying out such analysis is the visualization of data using beautiful graphs and figures.
In R language, the matplot(), plot(), and ggplot() are some of the most commonly used functions for plotting different graphs.
The width of axes and lines in such graphs is usually dependent on the type of device. Using the lwd Parameter, we can alter the thickness of plot lines in different functions.
In this tutorial, we will introduce how to set the thickness of the plot lines, the axes, and also the borders of the graph.
Set the Thickness of Plot Lines
Use the lwd Parameter to Set the Thickness of Plot Lines
In R, the lwd parameter is commonly used to set the thickness of plot lines. This parameter is often available in various plotting functions, and it stands for “line width”.
By adjusting the value of lwd, we can control the thickness of lines in your plots.
For example, first, we will plot a simple line graph using the plot() function. The sample() function here creates a random distribution of 100 elements.
Code:
plot(
    sample(100),
    type = "l"
)
In this code, we generate a line plot using the plot() function. We create a random distribution of 100 elements using the sample() function and specify the plot type as a line (type = 'l').
Output:
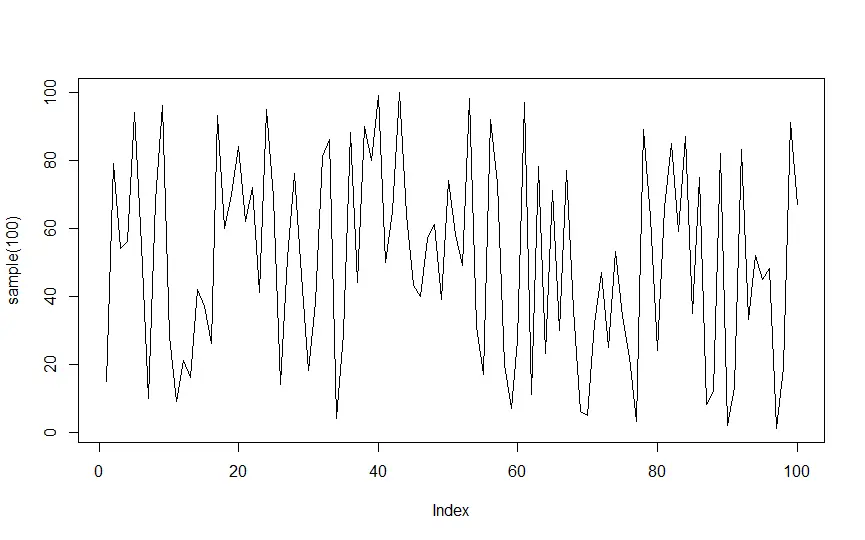
The output shows a simple line graph that visually represents the distribution of the sampled data points.
Now, to change the thickness of the plot line, we will insert the lwd parameter to the plot() function and set it to the desired value.
Code:
plot(
    sample(100),
    type = "l", lwd = 4
)
In this code, we are creating a line plot using the plot() function. Then, we generate a random distribution of 100 elements with the sample() function and set the plot type to a line (type = 'l').
Additionally, we use the lwd parameter and set it to 4, adjusting the line thickness to create a bolder appearance in the resulting plot.
Output:
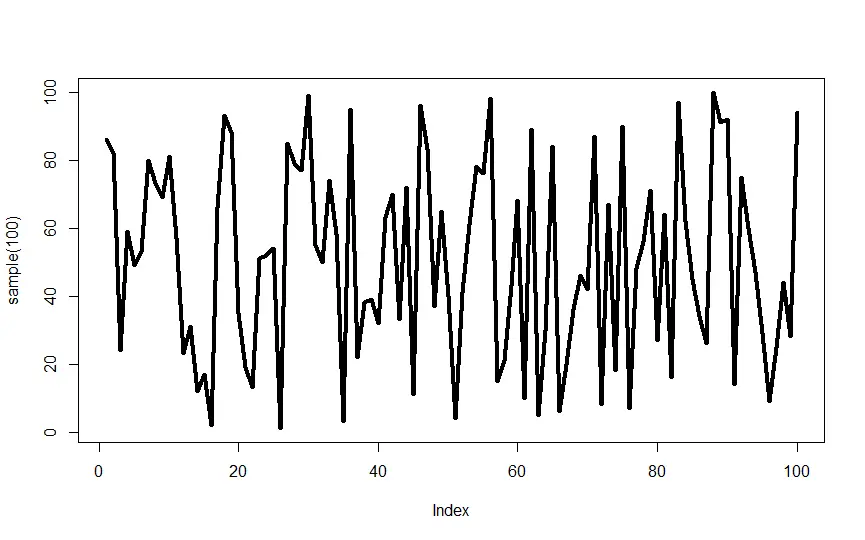
The output shows a line plot in R with a thicker line.
Use the par() Function With the lwd Parameter to Set the Thickness of Plot Lines
The par() function in R is used to set or query graphical parameters. The lwd parameter specifically controls the line width.
When we use par(lwd = value), you are setting the default line width for subsequent plots.
Code:
par(lwd = 3)
plot(
    sample(100),
    type = "l"
)
In this code, we set the default line width for subsequent plots using par(lwd = 3). Then, we create a line plot with a random distribution of 100 elements using the plot() function with type = "l".
Output:
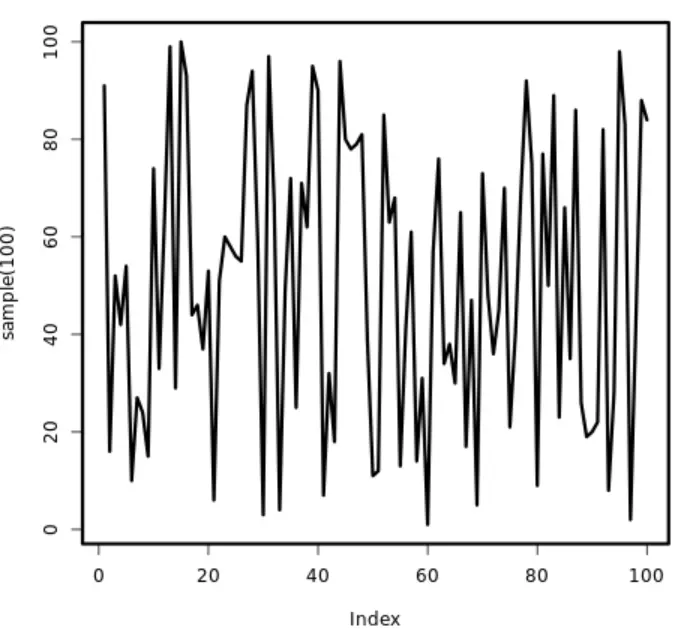
The same in the above code output shows the increase in the thickness of the plot lines. Similarly, we can also set the thickness of the axes and borders.
Set the Thickness of the Axes
We can use the lwd parameter within the relevant plotting functions to set the thickness of axes in R plots.
First, we will start with a simple scatter plot of a random distribution of 100 elements created using the sample() function. We’ll use the plot() function to plot this distribution.
Code:
plot(sample(100))
Output:
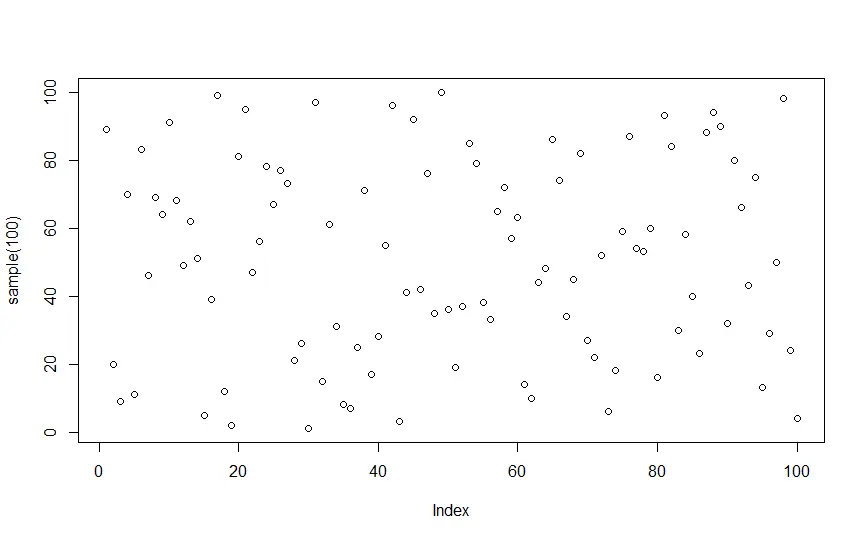
Now, we’ll use the axis() function. The function allows us to impose an axis to the current plot at a specific position or thickness, with other customization options available.
To set the axis’s thickness, we’ll change the lwd parameter and set it to the desired thickness.
plot(sample(100))
axis(side = 1, lwd = 3)
axis(side = 2, lwd = 3)
In this code, we generate a scatter plot with a random distribution of 100 elements using plot(sample(100)). Next, we customize the x-axis and y-axis separately using the axis() function.
Lastly, we set the line width (lwd) for both the x-axis (side = 1) and y-axis (side = 2) to 3.
Output:
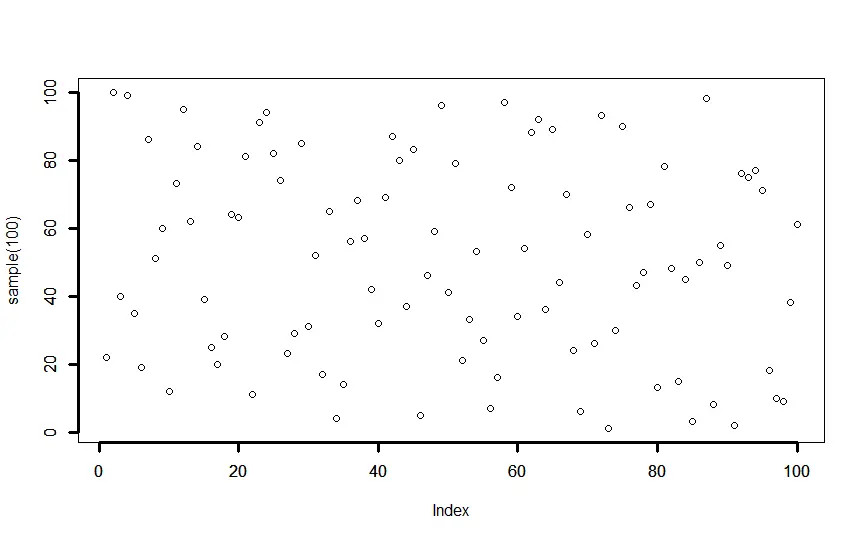
The output shows the thicker axes for improved visibility in the plot.
Set the Thickness of the Borders
We can add the box() function to add a box around the graph with some desired thickness. The box() function is often used to draw boxes around plots.
Unfortunately, the box() function does not have a direct parameter to control the thickness of the borders. However, we can achieve the desired effect by combining box() with the lwd parameter.
For example, we can add a box to a BoxPlot graph (we have also increased the thickness of the boxplot using boxlwd) as shown below.
Code:
boxplot(
    sample(100),
    horizontal = TRUE, notch = TRUE, boxlwd = 4
)
box(lwd = 2)
In this code, we create a horizontal boxplot using boxplot() with a random distribution of 100 elements. We set parameters such as horizontal = TRUE, notch = TRUE, and boxlwd = 4 to customize the boxplot’s appearance, making it horizontal, adding notches, and increasing the box’s line width.
Subsequently, we use box(lwd = 2) to draw a border around the boxplot with a line width of 2.
Output:
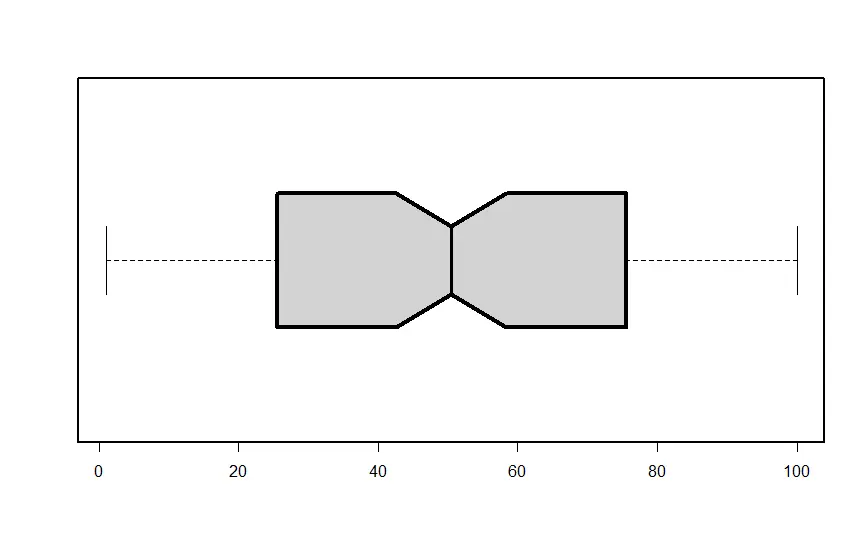
The output shows a horizontal boxplot of a random distribution with notches using a thicker box line (width 4). Additionally, it adds a border around the boxplot with a line width of 2.
Conclusion
In conclusion, R programming proves to be a versatile and widely used language for data and statistical analysis, with a crucial aspect being the visualization of data through graphs and figures. To enhance the visual representation of plots, we explored methods to set the thickness of plot lines, axes, and borders.
In manipulating plot lines, the lwd parameter emerges as a key tool, enabling control over line thickness across various plotting functions like plot(). Additionally, the par() function proves valuable for establishing a default line width for subsequent plots.
For axes customization, the lwd parameter within relevant plotting functions, such as axis(), allows us to precisely set the thickness of both x and y axes, providing flexibility in plot appearance.
While the box() function lacks a direct parameter for border thickness, combining it with the lwd parameter allows for the creation of visually appealing borders around plots. This is demonstrated in the context of a boxplot, showcasing the versatility of R for graph customization.
Overall, mastering these techniques empowers users to create visually compelling and informative plots tailored to their specific needs.

Manav is a IT Professional who has a lot of experience as a core developer in many live projects. He is an avid learner who enjoys learning new things and sharing his findings whenever possible.
LinkedIn