How to Plot 3D in MATLAB
-
Use the
mesh()Function to Create Surface Plots in MATLAB -
Use the
scatter3()Function to Create a 3D Scatter Plot in MATLAB -
Use the
contour3()Function to Create a 3D Contour Plot in MATLAB -
Use the
plot3()Function to Create a 3D Plot of Point or Line in MATLAB -
Use the
quiver3()Function to Create a 3D Quiver or Vector Plot in MATLAB -
Use the
bar3()Function to Create a 3D Bar Graph in MATLAB
This tutorial will discuss creating 3d plots using the mesh(), scatter3(), contour3(), plot3(), quiver3(), and bar3() functions in MATLAB.
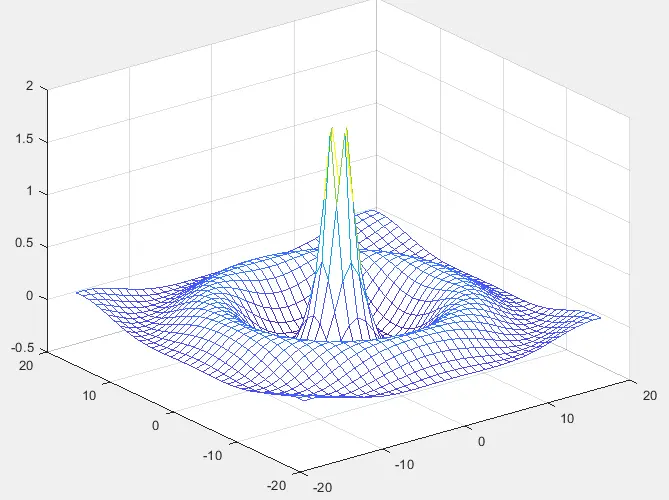
Use the mesh() Function to Create Surface Plots in MATLAB
Matlab’s built-in function mesh() creates the surface plots on a 3D plane. We can pass the matrix inside the mesh() function as a function that we want to plot in the 3D plane.
The mesh() function will plot the given matrix along the z-axis using the default value for the x-y coordinates. The x and y coordinates will be from the indices of the given matrix.
The given matrix will be plotted on the z-axis as heights on a three-dimensional plane.
For example, let’s create a matrix Z and plot it on the surface plot using the mesh() function in Matlab.
See the code below.
clc
[x,y] = meshgrid(-18:1:18);
r = sqrt(x.^2 + y.^2)/2;
z = cos(r)./r;
mesh(x,y,z)
Output:
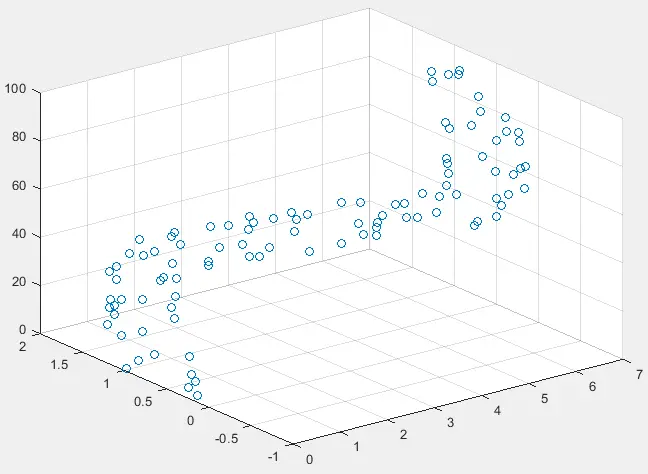
Use the scatter3() Function to Create a 3D Scatter Plot in MATLAB
If we want to create a 3D scatter plot, we can use the scatter3() function. This function is the same as the scatter() function, though it plots the given data in a 3D plane.
We can give two or three input vectors to the scatter3() function.
In the case of three inputs, the first vector contains the x coordinates, the second contains the y coordinates, and the third contains the z coordinates.
In the case of two input vectors, the third coordinate z will be taken from the indices of the first two coordinates.
For example, let’s plot a scatter plot in a 3D place using the scatter3() function.
See the code below.
clc
x = linspace(0,2*pi,100);
y = sin(x) + rand(1,100);
z = 1:100;
scatter3(x,y,z)
Output:
Check this link for more details about the scatter() function.
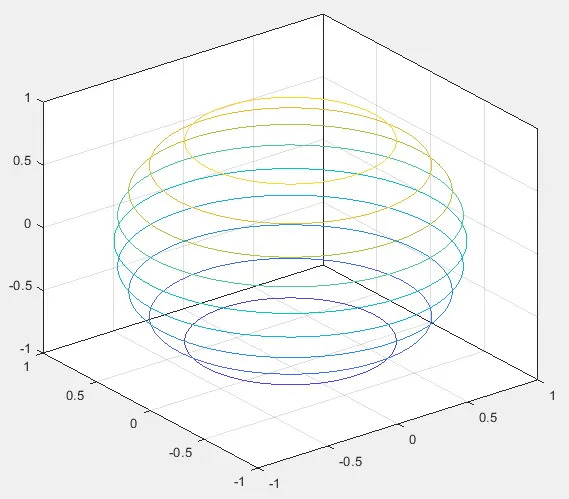
Use the contour3() Function to Create a 3D Contour Plot in MATLAB
We can use Matlab’s built-in function contour3() to create a 3D contour plot. A contour plot is a plot of isolines with different colors according to values.
The color given to the line depends on its value. The colder color corresponds to low values, and the hotter color corresponds to high values.
For example, let’s plot a 3D contour plot of a sphere using the sphere() and the contour3() function. See the code below.
clc
[x,y,z] = sphere(100);
contour3(x,y,z);
Output:
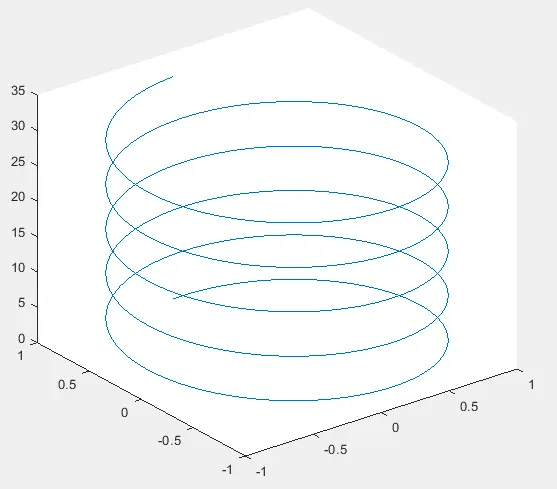
Use the plot3() Function to Create a 3D Plot of Point or Line in MATLAB
We already know about the plot() function in Matlab, which is used to plot data on a 2D plane. The plot3() function is similar to the plot() function.
The only difference is that the plot3() function plots data on a 3D plane. We can plot data as a line, aka a continuous plot, and as points, aka a discrete plot.
We have to pass three coordinates, x, y, and z, to plot the data on a 3D plane. For example, let’s plot a helix in 3D using the plot3() function.
See the code below.
clc
t = 0:pi/50:10*pi;
sinet = sin(t);
cost = cos(t);
plot3(sinet,cost,t)
Output:
Check this link for more details about the plot3() function.
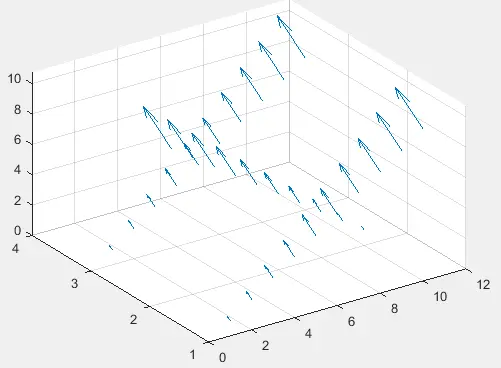
Use the quiver3() Function to Create a 3D Quiver or Vector Plot in MATLAB
Matlab’s built-in function quiver3() can be used to plot a 3D quiver or vector plot. A scalar consists of only magnitude, but a vector contains magnitude and direction.
We can create a 3D plot of scalar data using the plot3() function, but we cannot plot vector data using the plot3() function because the function will not plot the direction of the vector.
In the case of vector, we can use the quiver3() function, which will plot the magnitude and direction of the vector.
For example, let’s create a matrix and plot it on a 3D plane with direction. See the code below.
clc
m = [1:10 ;10:-1:1;1:10];
quiver3(m,m,m,m)
Output:
Check this link for more details about the quiver3() function.
Use the bar3() Function to Create a 3D Bar Graph in MATLAB
We can use Matlab’s built-in function bar3() to plot a bar graph in a 3D plane. We must pass the data’s input matrix, plotted as heights on the z-axis in a 3D plane.
The other two coordinates (x and y) will be taken from the indices of the given matrix. For example, let’s create a 3D bar graph from a given matrix.
See the code below.
clc
m = [1:10 ;10:-1:1;1:10];
bar3(m)
Output:

Check this link for more details about the bar3() function.
