How to Plot 3D Line or Point in MATLAB
This tutorial will discuss creating a 3D plot of point or line using the plot3() function in MATLAB.
Create a 3D Plot of Point or Line Using the plot3() Function in MATLAB
We already know about the plot() function in MATLAB, which is used to plot data on a 2D plane.
The plot3() function is similar to the plot() function. The only difference is that the plot3() function plots data on a 3D plane.
We can plot data as a line known as a continuous plot, and as points, which is also known as a discrete plot. We have to pass three coordinates, x,y, and z, to plot the data on a 3D plane.
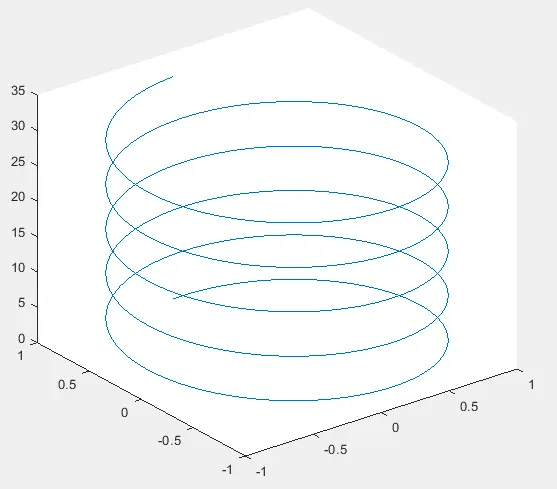
For example, let’s plot a helix in 3D using the plot3() function. See the code below.
t = 0:pi/50:10*pi;
sinet = sin(t);
cost = cos(t);
plot3(sinet,cost,t)
Output:
We can also plot multiple lines simultaneously by using multiple inputs inside the plot3() function.
For example, let’s plot two lines using six inputs and the plot3() function. See the code below.
time = 0:pi/500:pi;
xs1 = sin(time).*cos(10*time);
ys1 = sin(time).*sin(10*time);
zs1 = cos(time);

xs2 = sin(time).*cos(12*time);
ys2 = sin(time).*sin(12*time);
zs2 = cos(time);
plot3(xs1,ys1,zs1,xs2,ys2,zs2)
Output:
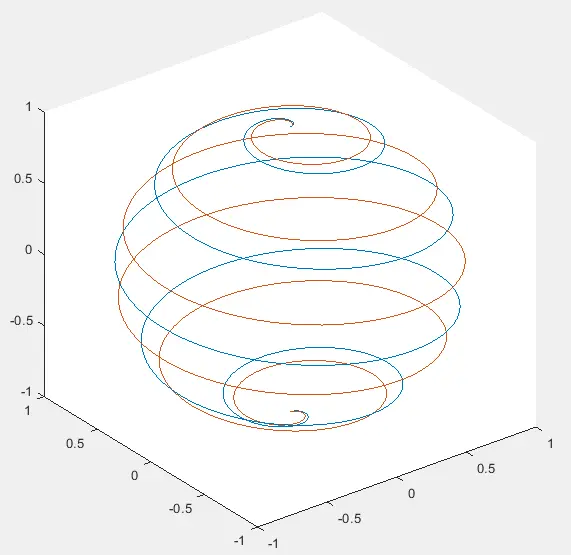
In the case of multiple lines, the plot3() function will give each line a different color. We can also use the legend() function to give each line a unique name. Check this link for more details about legends in MATLAB.
Instead of passing six arguments, you can save coordinates of multiple data into a single matrix.
For example, in the above case, we can save x coordinate of each data in a single matrix as columns, and the same goes for the rest of the coordinates. Then we only have to pass three inputs.
We can also add labels to each axis of the 3D plot using the xlabel() function for x-axis label, ylabel() for the y-axis label, and label() for the z-axis label. We can also give the title the plot using the title() function.
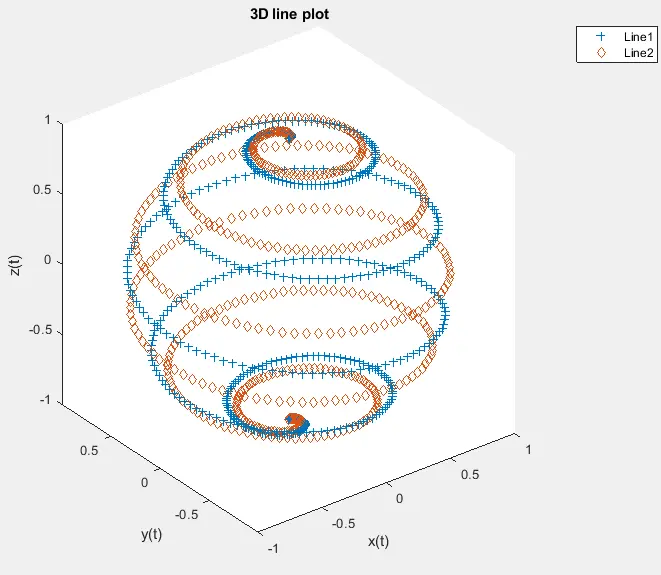
We can even change the line to points for discrete plot using different markers like o for circle, + for the plus sign, * for asterisk, and d for diamond.
For example, let’s plot the above graph in discrete form and add labels and titles to the plot. See the code below.
time = 0:pi/500:pi;
xs1 = sin(time).*cos(10*time);
ys1 = sin(time).*sin(10*time);
zs1 = cos(time);

xs2 = sin(time).*cos(12*time);
ys2 = sin(time).*sin(12*time);
zs2 = cos(time);
plot3(xs1,ys1,zs1,'+',xs2,ys2,zs2,'d')
legend('Line1','Line2')
axis equal
xlabel('x(t)')
ylabel('y(t)')
zlabel('z(t)')
title('3D line plot')
Output:
We can also change other properties like the line style using the LineStyle property, line color using the Color property, line width using the LineWidth property, marker size using the MarkerSize property, marker edge color using the MarkerEdgeColor property, marker face color, or marker fill color using the MarkerFaceColor property.
We can also change the line style, marker, and color simultaneously using the LineSpec property. For example, let’s change some properties of the above graph. See the code below.
time = 0:pi/500:pi;
xs1 = sin(time).*cos(10*time);
ys1 = sin(time).*sin(10*time);
zs1 = cos(time);

plot3(xs1,ys1,zs1,'LineStyle','--','Color','red','LineWidth',3)
legend('Line1','Line2')
axis equal
xlabel('x(t)')
ylabel('y(t)')
zlabel('z(t)')
title('3D line plot')
Output:
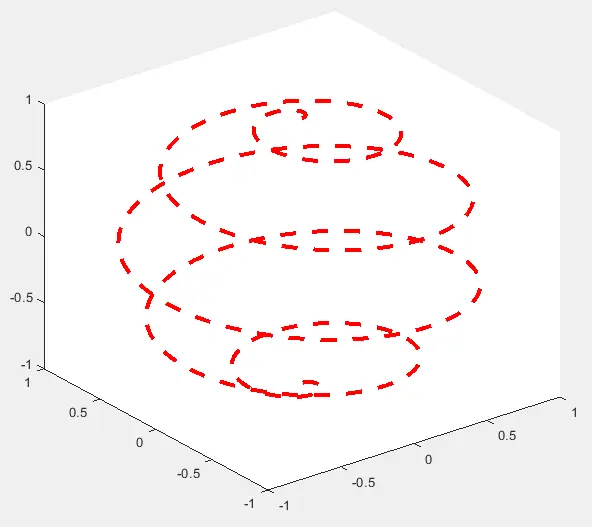
We supported line styles of the plot3() function are - for a solid line, -- for dashed line, : for dotted line, -. for the dashed-dotted line. We can use the name of the color or the RGB triplet value to change the color of the line or marker.
The default line width is 0.5, but we can set its value using any positive value. The marker size value is six by default, but we can change it to any positive value.
By default, the marker edge color is set to auto, and marker face color is set to none, but we can give any color to the markers using the color name or the RGB triplet value.

Related Article - MATLAB Plot
- MATLAB Waterfall Plot
- How to Create Polar Plot in MATLAB
- How to Plot Multiple Data Sets on a Single Scatter Plot in MATLAB
- The caxis() Function in MATLAB
- How to Use Greek Symbols in Bar Graph Labels in MATLAB
- How to Plot Exponential Function of Any Equation in MATLAB