How to Plot Multiple Data Sets on a Single Scatter Plot in MATLAB
This tutorial will discuss plotting multiple data sets on a single scatter plot using the scatter() function and hold on command in MATLAB.
Plot Multiple Data Sets on a Single Scatter Plot in MATLAB
The scatter() function of Matlab plots the given data set as circles or bubbles on a 2D plot, and the scatter3() function plots the data set on a 3D plot. We can also change many properties of the circles or bubbles of scatter plots, such as their size and color, using the scatter() function.
The scatter() and scatter3() function has been discussed on this site with examples, but we only plotted a single data set on that topic. Check this link to look at the topic before moving forward.
Now we will discuss how to plot multiple data sets on a single scatter plot in Matlab. We have to use the scatter() function for each data set separately to plot it on the scatter plot.
Suppose we use multiple plotting functions in Matlab. In that case, only the last plot will be visible because the last plot will overwrite all the other plots, and we will only see the last plot, but we can disable this behavior of Matlab using the hold on command of Matlab.
We have to use the hold on command each time we plot a scatter plot except for the first scatter plot to plot all the given data sets on the same plot.
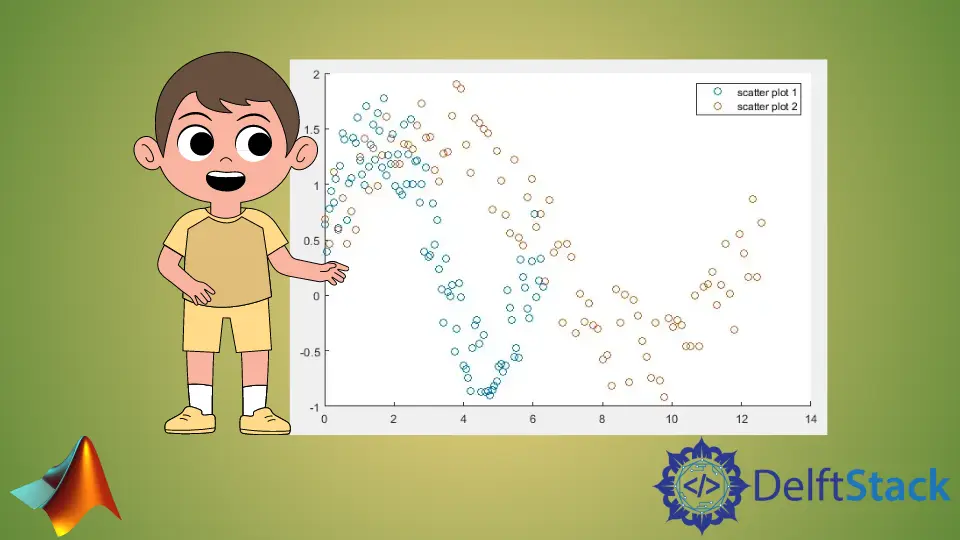
For example, let’s create and plot two data sets on the same scatter plot in Matlab. See the code below.
clc
clear

x = linspace(0,2*pi,100);
y = sin(x) + rand(1,100);
scatter(x,y)

x1 = linspace(0,4*pi,100);
y1 = sin(x) + rand(1,100);
hold on
scatter(x1,y1)
legend('scatter plot 1','scatter plot 2')
Output:

We plotted the first data set in the above code and then used the hold on command before plotting the second data set. We have also used the legend() function to display which color belongs to which data set.
The number of arguments of the legend() function is equal to the number of data sets plotted on a single scatter plot. We can give each data set a unique name to distinguish it from other data sets.
If we plot multiple data sets on the same scatter plot, Matlab will give each data set a different color so that they will be different from one another. We can see in the above output that both data sets have different colors, and the legend on the plot gives information about the data set according to its color.
The axis limits can change in multiple scatter plots depending on the data sets. So we mustn’t set the axis limits because some data sets might be long, and if we set the short axis limits, the whole data set will not be covered on the plot.
We can also use the scatter3() function for multiple plots in a 3D plane, in the same way we used the scatter() function.
