MATLAB Waterfall Plot

This tutorial will discuss creating a waterfall plot using MATLAB’s waterfall() function.
The MATLAB Waterfall Plot
A waterfall plot is like a mesh plot; it also has curtains on the y-axis, creating a waterfall effect on the plot. We can use the waterfall() function of MATLAB to create a 3D waterfall plot.
The waterfall() function has six syntaxes shown below.
waterfall(x,y,z)
waterfall(x,y,z,color)
waterfall(z)
waterfall(z,c)
waterfall(axes,___)
obj = waterfall(___)
The first syntax will create a waterfall plot on a grid specified by the x and y variables, and the heights of the edges will be taken from the variable z. By default, the waterfall() function will use the z variable to assign colors to the edges present in the plot.
The input variables x and y should be a matrix or vector, and variable z should be a matrix and it should have two rows and two columns. If x and y are matrices, their size should equal the size of variable z.
The second syntax is used to set the color of the edges, which will replace the default color of the edges. The color should be a matrix of the same size as the number of edges and contain the colors of all the edges in the plot.
For example, let’s create a waterfall plot of some random data using the waterfall() function. See the code below.
clc
clear

[x,y] = meshgrid(-6:.3:6);
z = x.*cos(y) + y.*sin(x);
waterfall(x,y,z)
Output:
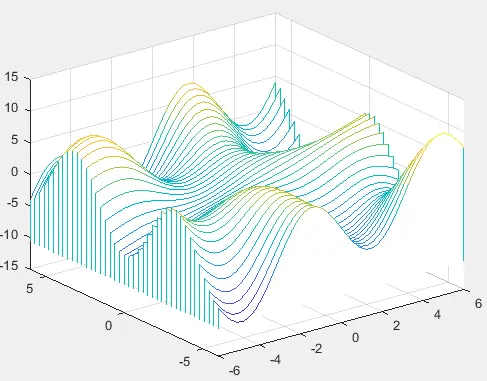
We used the meshgrid() in the above code to create a uniform grid. The colors of the edges are assigned according to the matrix z.
We can use the colorbar command after the waterfall() function, which will show a color bar along the waterfall plot that can be used to see which color belongs to which value.
The third syntax will create a waterfall plot according to the heights of variable z, and it will take the grid values or the values of x and y from the indices of the z matrix. The color will also be taken from the z matrix.
The fourth syntax can specify the colors of the edges present in the matrix z in matrix c so that the size of c will equal the size of z. The fifth syntax will be used to create the waterfall plot on the axes specified by the axes variable instead of the current axes of the plot.
The sixth syntax is used to create an object of the waterfall plot, which can be used to show and modify the properties of the waterfall plot. For example, let’s create an object of the waterfall() function using the above example code and check its properties.
See the code below.
clc
clear

[x,y] = meshgrid(-6:.3:6);
z = x.*cos(y) + y.*sin(x);
p = waterfall(x,y,z);
Output:
p =

  Patch with properties:

    FaceColor: [1 1 1]
    FaceAlpha: 1
    EdgeColor: 'flat'
    LineStyle: '-'
        Faces: [41×46 double]
     Vertices: [1886×3 double]
The above output shows some properties of the waterfall plot, and we can see all the properties by clicking on the Path word in the output. We can change the properties of the waterfall plot using the object of the function and property name.
The first property, FaceColor shown above, represents the color of the area enclosed by the edges, which by default is set to white color, but we can change it to any color using a color name or an RGB triplet value.
The EdgeColor property represents the color of the edges or points on the plot which by default are assigned using the value of the matrix z, but we can also change this property in the same way as we change the FaceColor property.
The FaceAlpha and EdgeAlpha properties are used to set the transparency of the faces and the edges present in the plot, which by default is set to 1, but we can set it to any value between 0 to 1.
The LineStyle property sets the style of the lines used to join the points on the plot, and by default, its value is set to a solid like -, but we can set it to a dashed line using --, dashed dot line using -., dotted line using :, and no line using none.
The LineWidth property is used to set the width of the line used in the plot, and by default, its value is set to 0.5, but we can set its value to any positive integer.
The Marker property is used to set the marker which will be used to represent the points on the plot, and by default, its value is set to none, but we can set it to a circle using o, diamond using d, pentagon using p, and so on.
We can use the MarkerSize property to set the marker size, which by default is set to 5, and set it to any positive value.
We can use the MarkerEdgeColor property to set the color of the edge line of the marker and MarkerFaceColor to set the fill color of the marker, which will be used to fill the marker with color, and by default, its value is set to none.
For example, let’s repeat the above example and change the properties mentioned above. See the code below.
clc
clear

[x,y] = meshgrid(-6:1:6);
z = x.*cos(y) + y.*sin(x);
p = waterfall(x,y,z);
p.FaceColor = 'white';
p.EdgeColor = 'red';
p.LineStyle = '-.';
p.LineWidth = 1;
p.Marker = 'd';
p.MarkerSize = 10;
p.MarkerEdgeColor = 'green';
p.MarkerFaceColor = 'yellow';
Output:
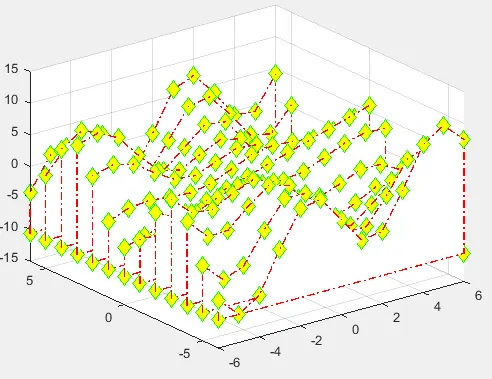
In the above code, we changed some properties of the waterfall plot, and we can also change many other properties. Check this link for more details about the properties of the waterfall plot.
Check this link for more details about the waterfall() function.
