The caxis() Function in MATLAB
This tutorial will discuss setting the colormap limits using the caxis() or clim() function in MATLAB.
Use the caxis() Function in MATLAB
The caxis() function, which is renamed to clim() function in MATLAB’s version R2022a, is used to set the limits of the colormap in different plots. We can use the caxis() function if the MATLAB version is older than the version R2022a and if the version is R2022a or newer, we have to use the clim() function.
The caxis() or clim() function have five syntaxes which are given below.
Syntax:
clim(axis_limits)
clim("auto")
clim("manual")
clim(target_axis,___)
lims_object = clim
The clim(axis_limits) sets the limits of the colormap according to the limits present in the axis_limits variable. The axis_limits variable should be a two-element vector, where the first value defines the minimum limit and the second value defines the maximum limit.
If there are values in the default colormap which are less than or equal to the minimum limit of the new colormap limits, then the previous values will be mapped to the first row of the new colormap. If there are values in the default colormap which are greater than or equal to the maximum limit of the new colormap limits, then the previous values will be mapped to the last row of the new colormap.
The clim("auto") is the default behavior of the function, which will set the colormap limits according to the indexes of the plot. We can also use the clim auto or caxis auto command instead of the above syntax to set the limits to auto.
The clim("manual") will turn off the automatic limit updates. We can also use the clim manual or caxis manual command instead of the above syntax to disable automatic limit updates.
Theclim(target_axis,___) is used to specify the axis whose colormap values we want to change. This syntax is useful if we don’t want to change the colormap limits of all the colormaps present in the current plot.
The lims_object = clim will return the colormap limits of the current colormap. For example, let’s change the default colormap limits of a surface plot.
Example Code:
[x_axis,y_axis] = meshgrid(-6:.5:6);
z_axis = x_axis.^2 + y_axis.^2;
surf(z_axis);
colorbar
previous_limits = caxis
caxis([20 50])
current_limits = caxis
Output:
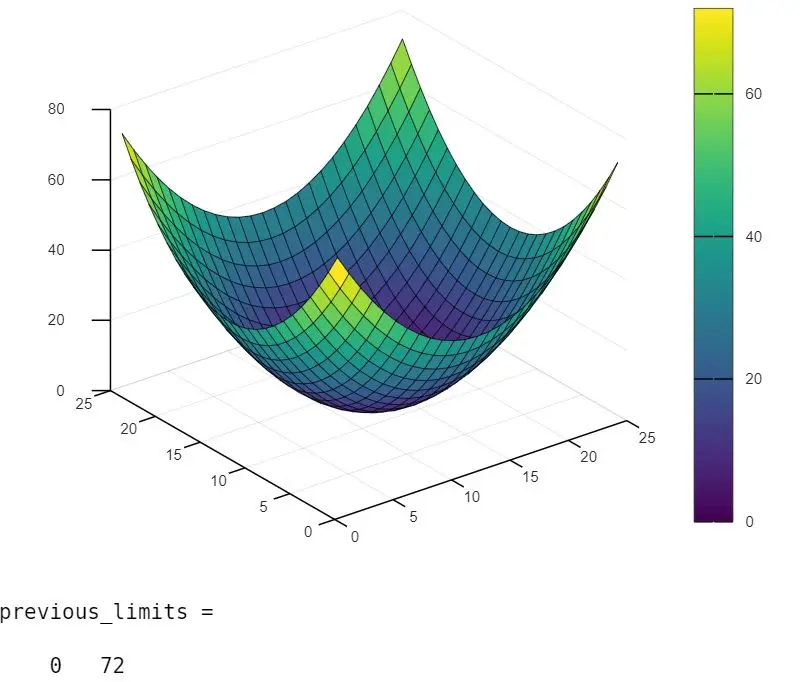
We used the meshgrid() function to create a grid for the surface plot. We use the surf() function to create the surface plot and the colorbar command to create a bar of colors that will show the value for the corresponding color present in the plot.
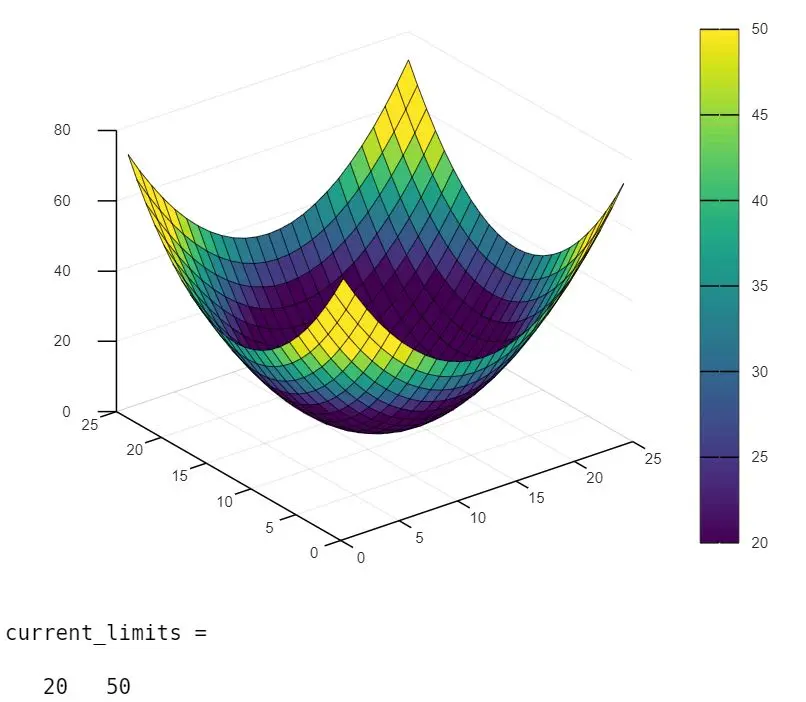
The output shows that the previous colormap limits are 0 to 72 and the new limits are 20 to 50. Check this article for more details about the caxis() or clim() function.
