How to Use Greek Symbols in Bar Graph Labels in MATLAB
This tutorial will discuss adding Greek symbols to a plot using the text() function in MATLAB.
Use Greek Symbols in Bar Graph Labels in MATLAB
We can easily add numbers and characters present on the keyboard to the plot in Matlab, but the Greek symbols are not available on the keyboard of a computer. We need an interpreter to convert the Greek symbol name to its respective symbol to add Greek symbols.
We can use the text() function of Matlab, which by default has the same text interpreter as the other plotting function in Matlab, which is tex, but we can change its interpreter to latex which will convert the name of a Greek symbol to it respective symbol form. The text() function puts text on a plot on the given coordinates.
According to the current axes, the coordinates passed inside the function text() are used by the plot. The first two arguments of the text() function contain the x and y-axis coordinates, and the third argument contains the text we want to put on the plot.
To put Greek symbols on a plot, we need to use the interpreter property of the text() function and set it to latex which will convert the name of the Greek symbol to its symbol representation. We have to put the name of the Greek symbol inside double dollar signs, and we also have to add a backslash before the name of the Greek symbol like $$\sigma$$ for the Greek symbol sigma.
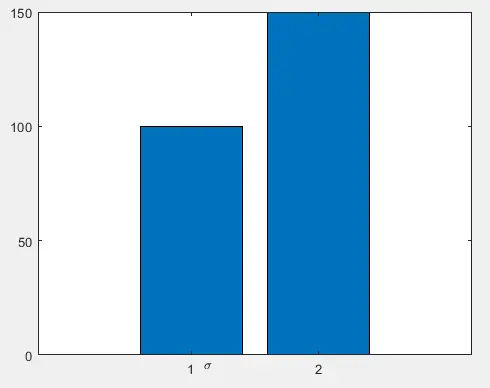
For example, let us make a bar graph and put the Greek symbol sigma using the text() function. See the code below.
Example code:
clc
clear

y = [100, 150];
bar(y);
text(1.1,-5,'$$\sigma$$','interpreter', 'latex')
Output:
As we can see in the output, there is a sigma symbol on the x-axis near the number 1. We can also change the properties of the text, like the color and font size.
To change the color of the text, we can use the Color property and set the color using the first letter of the color name, RGB triplet value, or hexadecimal code. We can use the FontSize property to set the font size of the text and set the size using a numeric value.
For example, let us change the font size and color of the above sigma symbol. See the code below.
Example code:
clc
clear

y = [100, 150];
bar(y);
text(1.1,-5,'$$\sigma$$','interpreter', 'latex','FontSize',25,'Color','r')
Output:
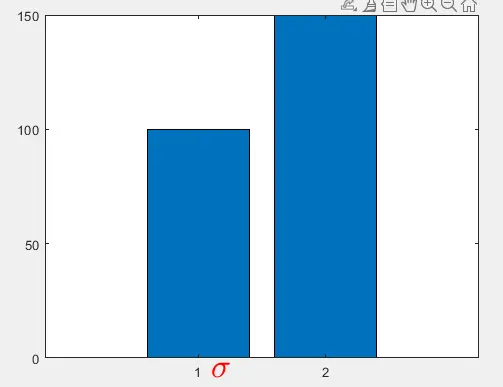
As we can see in the above output, the color and the font size of the sigma symbol are changed in the plot. We can also replace the original x or y-axis tick symbols or labels present on the plot.
First, we have to set the tick symbols to none using an empty array and the set() function, which is used to set the properties of a graphical object like plots. After that, we have to put the new symbols in the place of the previous symbols using the text() function.
We can use the get() function to get the coordinates or position of the previous tick labels and place the new labels or symbols on the plot.
For example, let us create a bar plot and replace the x-axis tick labels with the symbol pie. See the code below.
Example code:
clc
clear

y = [51,93,101];
bar(y, 'BarWidth', 0.4);
label = {'$$\hat{\pi}_1$$', '$$\hat{\pi}_2$$', '$$\hat{\pi}_3$$'};
set(gca,'xticklabel',[])

xTicksLoc = get(gca,'xtick');

axe = axis;
for i = 1:length(xTicksLoc)
     text(xTicksLoc(i)+0.1, axe(2)-10, label{i},...
         'HorizontalAlignment','Right','interpreter', 'latex','FontSize',22);
end
Output:
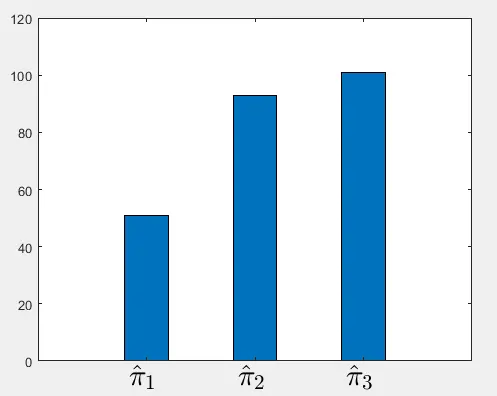
In the above code, we saved the location of the x-axis tick labels and used them inside the text() function to replace the plot symbols. We used a for loop to set all the labels with the symbol pi.
Inside the for loop, we used the saved position of the previous labels and an offset 0.1, which we can use to set the horizontal position according to the given plot. We used the axes(2) command to get the y-axis location and added an offset so that the symbols would be below the y-axis line.
The offset values depend on the given plot. We can also change the y-axis labels in the same way we changed the x-axis labels.
In the case of y-axis labels, we have to set the y-axis tick labels to none, get the position of the y-axis tick labels, and use the location in the second argument of the text() function, which corresponds to the y-axis tick locations. We can put almost all the Greek symbols on a plot, and we can also change many other properties of the text or Greek symbols using the text() function.
Check this link for more details about the text() function properties and the Greek symbols that we can put on plots.
If we do not want to change all the tick labels and only want to put a label for the whole x or y-axis, we can use the xlabel() and ylabel() functions. And to put a Greek symbol, we have to set the interpreter to latex as we did in the case of the text() function.
