How to Plot 3D Quiver or Vector in MATLAB
This tutorial will discuss creating a 3D quiver or vector plot using the quiver3() function in MATLAB.
Create a 3D Quiver or Vector Plot Using the quiver3() Function in MATLAB
We can use MATLAB’s built-in function quiver3() to plot a 3D quiver or vector plot.
A scalar consists of only magnitude, but a vector contains magnitude as well as direction. We can create a 3D plot of scalar data using the plot3() function, but we cannot plot vector data using the plot3() function because the function will not plot the direction of the vector.
In the case of vector, we can use the quiver3() function, which will plot the magnitude and direction of the vector. For example, let’s create a matrix and plot it on a 3D plane with direction. See the code below.
m = [1:10 ;10:-1:1;1:10];
quiver3(m,m,m,m)
Output:
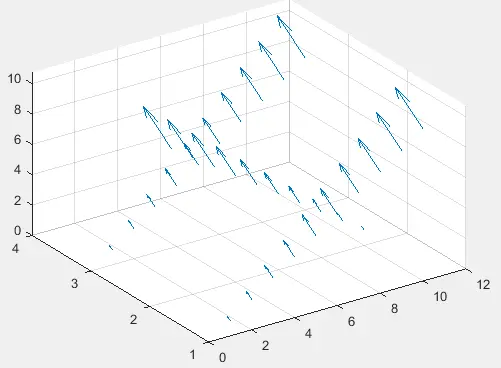
We have to pass a minimum of four inputs in the quiver3() function to plot arrows with directional components specified by the last three inputs.
The size of all four inputs should be the same. The last three inputs are the directional components, and the first input is the z-axis along which the directional components will be plotted.
If the first input is a vector, then the x coordinates of the arrows will be from 1 to the number of elements in the first input, and the y coordinates are all equal to 1. If the first input is a matrix, then the x coordinates of the arrows will be from 1 to the number of columns in the input matrix, and the y coordinates will be from 1 to the number of rows in the input matrix.
Instead of passing a single axis, we can also pass three axes, x, y, and z, in the quiver3() function. Now the arrows will extend according to the three input coordinates rather than one coordinate.
We can also set other properties of the quiver3() function like the length of the arrows, line specifications, line width, arrowhead display, automatic scaling of arrow length, and scale factor.
By default, the arrow scaling factor scales the arrow so they won’t overlap, but we can also turn it off. By default, the color of the arrows is set to auto, but we can give them any color by using the name of the color and Color property.
By default, the line width is set to 0.5, but we can set it to any positive numeric value using the LineWidth property. The arrowhead display is on by default, but we can turn it off using the ShowArrowHead property.
The autoscale is turned on by default, but we can turn it off using the AutoScale property. By default, the value of the auto-scale factor is set to 0.9, but we can set it to any scalar value using the AutoScaleFactor.
We can also set the labels and the title of the plot using the xlabel(), ylabel(), zlabel(), and title() function. For example, let’s change some properties of the above quiver plot. See the code below.
m = [1:10 ;10:-1:1;1:10];
quiver3(m,m,m,m,'LineWidth',2,'Color','red','AutoScale','off')
xlabel('x-axis')
ylabel('y-axis')
zlabel('z-axis')
title('Quiver Plot')
Output:
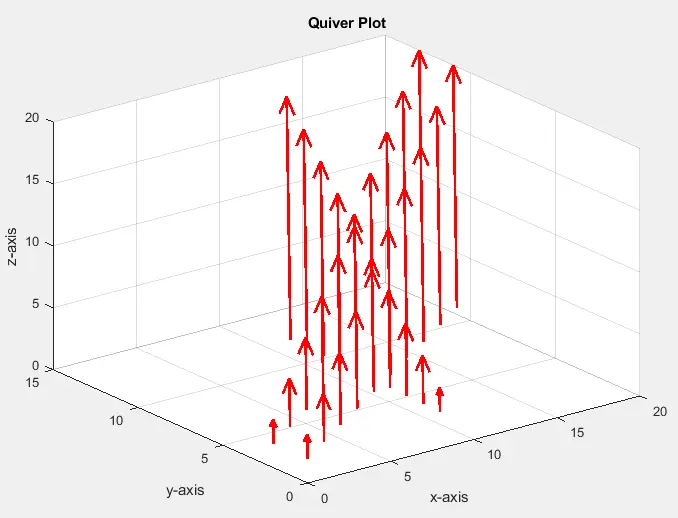
In the output, the arrows overlap because the auto-scaling is turned off.

Related Article - MATLAB Plot
- MATLAB Waterfall Plot
- How to Create Polar Plot in MATLAB
- How to Plot Multiple Data Sets on a Single Scatter Plot in MATLAB
- The caxis() Function in MATLAB
- How to Use Greek Symbols in Bar Graph Labels in MATLAB
- How to Plot Exponential Function of Any Equation in MATLAB