MATLAB 中的 3D 线图或点图

本教程将讨论使用 MATLAB 中的 plot3() 函数创建点或线的 3D 图。
使用 MATLAB 中的 plot3() 函数创建点或线的 3D 图
我们已经知道 MATLAB 中的 plot() 函数,该函数用于在 2D 平面上绘制数据。
plot3() 函数类似于 plot() 函数。唯一的区别是 plot3() 函数在 3D 平面上绘制数据。
我们可以将数据绘制为称为连续图的线,也可以绘制为点,也称为离散图。我们必须传递三个坐标 x、y 和 z,才能在 3D 平面上绘制数据。
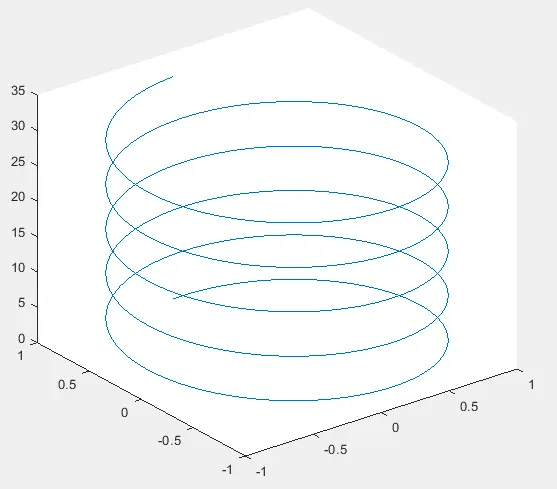
例如,让我们使用 plot3() 函数在 3D 中绘制一个螺旋线。请参阅下面的代码。
clc
t = 0:pi/50:10*pi;
sinet = sin(t);
cost = cos(t);
plot3(sinet,cost,t)
输出:
我们还可以通过在 plot3() 函数中使用多个输入来同时绘制多条线。
例如,让我们使用六个输入和 plot3() 函数绘制两条线。请参阅下面的代码。
clc
time = 0:pi/500:pi;
xs1 = sin(time).*cos(10*time);
ys1 = sin(time).*sin(10*time);
zs1 = cos(time);

xs2 = sin(time).*cos(12*time);
ys2 = sin(time).*sin(12*time);
zs2 = cos(time);
plot3(xs1,ys1,zs1,xs2,ys2,zs2)
输出:
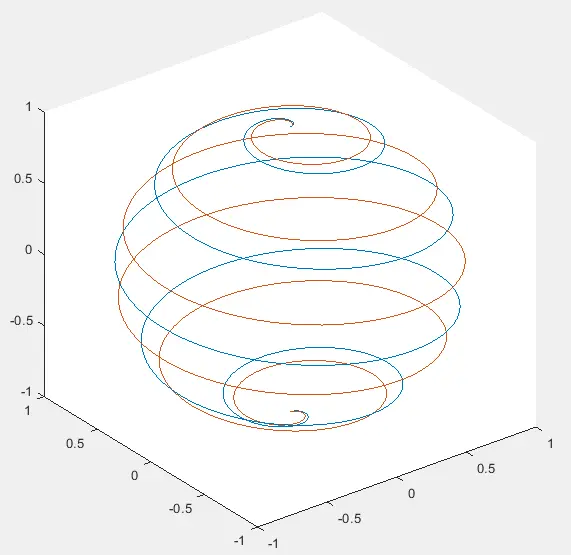
在多条线的情况下,plot3() 函数将为每条线赋予不同的颜色。我们还可以使用 legend() 函数为每一行指定一个唯一的名称。查看此链接以了解有关 MATLAB 中图例的更多详细信息。
你可以将多个数据的坐标保存到单个矩阵中,而不是传递六个参数。
例如,在上述情况下,我们可以将单个矩阵中每个数据的 x 坐标保存为列,其余坐标也是如此。然后我们只需要传递三个输入。
我们还可以使用 xlabel() 函数为 x 轴标签、ylabel() 为 y 轴标签和 label() 为 z 轴标签添加标签到 3D 绘图的每个轴。我们还可以使用 title() 函数为标题指定绘图。
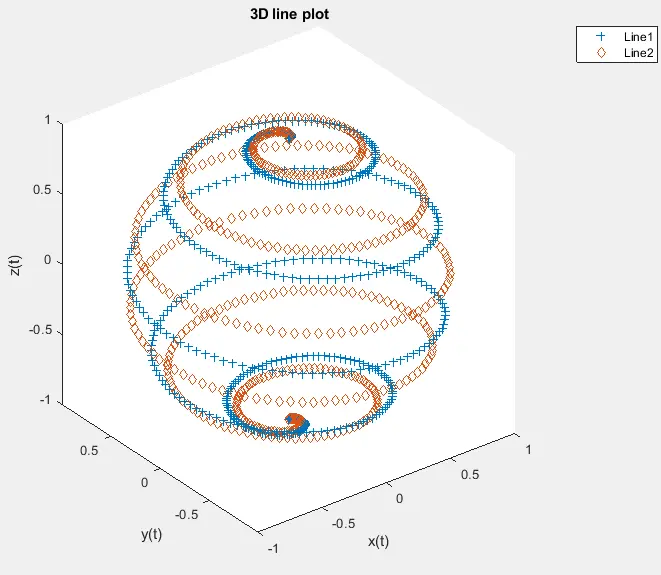
我们甚至可以使用不同的标记将线更改为离散图的点,例如 o 表示圆圈,+ 表示加号,*表示星号,d 表示菱形。
例如,让我们以离散形式绘制上述图形,并为图形添加标签和标题。请参阅下面的代码。
clc
time = 0:pi/500:pi;
xs1 = sin(time).*cos(10*time);
ys1 = sin(time).*sin(10*time);
zs1 = cos(time);

xs2 = sin(time).*cos(12*time);
ys2 = sin(time).*sin(12*time);
zs2 = cos(time);
plot3(xs1,ys1,zs1,'+',xs2,ys2,zs2,'d')
legend('Line1','Line2')
axis equal
xlabel('x(t)')
ylabel('y(t)')
zlabel('z(t)')
title('3D line plot')
输出:
我们还可以使用 LineStyle 属性更改其他属性,例如使用 LineStyle 属性更改线条样式,使用 Color 属性更改线条颜色,使用 LineWidth 属性更改线条宽度,使用 MarkerSize 属性更改标记大小,使用标记边缘颜色 MarkerEdgeColor 属性、标记面颜色或使用 MarkerFaceColor 属性的标记填充颜色。
我们还可以使用 LineSpec 属性同时更改线条样式、标记和颜色。例如,让我们更改上图的一些属性。请参阅下面的代码。
clc
time = 0:pi/500:pi;
xs1 = sin(time).*cos(10*time);
ys1 = sin(time).*sin(10*time);
zs1 = cos(time);

plot3(xs1,ys1,zs1,'LineStyle','--','Color','red','LineWidth',3)
legend('Line1','Line2')
axis equal
xlabel('x(t)')
ylabel('y(t)')
zlabel('z(t)')
title('3D line plot')
输出:
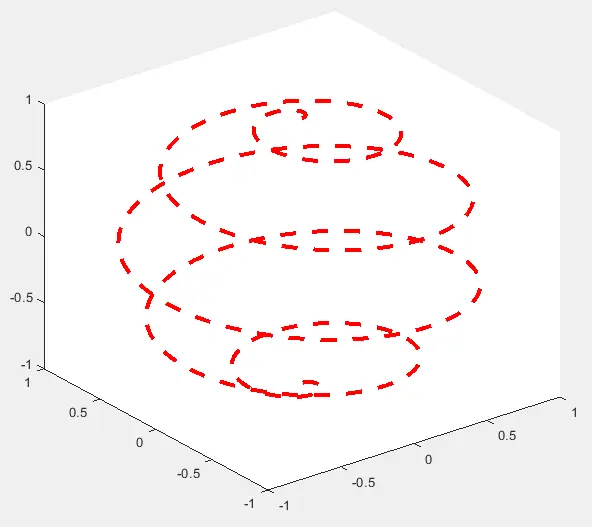
我们支持的 plot3() 函数的线条样式是 - 代表实线,-- 代表虚线,: 代表虚线,-. 对于点划线。我们可以使用颜色名称或 RGB 三元组值来更改线条或标记的颜色。
默认线宽为 0.5,但我们可以使用任何正值设置其值。默认情况下,标记大小值为 6,但我们可以将其更改为任何正值。
默认情况下,标记边缘颜色设置为自动,标记面颜色设置为无,但我们可以使用颜色名称或 RGB 三元组值为标记指定任何颜色。
