How to Create Custom Legend in MATLAB
-
Add Custom Legends Using the
legend()Function in MATLAB -
Add Custom Legends Using the
text()Function in MATLAB - Conclusion

Creating clear and informative plots is a fundamental aspect of data visualization in MATLAB. Legends play a vital role in aiding the understanding of plotted data and providing context and clarity to the information being presented.
While MATLAB’s built-in legend() function is commonly used to add legends to plots, it has its limitations when it comes to customization. This article explores how to enhance legend customization using both the legend() and text() functions in MATLAB.
Add Custom Legends Using the legend() Function in MATLAB
The legend() function in MATLAB is a valuable tool used to add legends to a plot, aiding in the interpretation of data and enhancing the visualization. Its basic syntax is as follows:
legend('label1', 'label2', ...)
'label1', 'label2', ...: These are the legend labels corresponding to the plotted data or any other custom labels you want to display. Each label is a string enclosed in single quotes.
However, it’s worth noting that the legend() function is designed to add a single legend to a plot. Attempting to add more than one legend using this function will result in a MATLAB error.
In order to overcome this limitation and add custom legends that aren’t directly related to the graphed data, a workaround involves adding more plots to the figure with undefined values. These additional plots serve as placeholders, allowing the inclusion of multiple legends.
Although the plots themselves won’t be visible due to their undefined values, the legends associated with them will be displayed.
Take a look at the example below:
t = 1:0.01:2;
plot(cos(2*pi*t))
hold on
p(1) = plot(NaN,NaN);
p(2) = plot(NaN,NaN);
p(3) = plot(NaN,NaN);
hold off
legend(p,'Cos1','Cos2','Cos3')
Output:
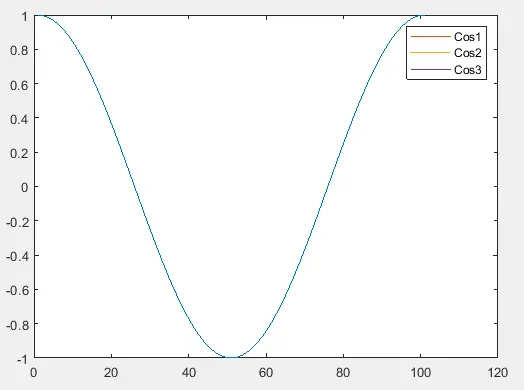
In this provided code, we begin by creating a time vector t using the colon operator, generating values from 1 to 2 with a step size of 0.01. Next, we plot a cosine wave using cos(2*pi*t), creating the main plot that we want to display.
To prepare for adding custom legends unrelated to this plot, we employ hold on, ensuring subsequent plots are added to the existing figure. Then, we generate three additional plots using plot(NaN,NaN), essentially creating dummy plots with undefined values.
These serve as placeholders to facilitate the addition of custom legends.
After setting up the placeholder plots, hold off is used to disable the hold state, allowing any subsequent plots to replace the current plot.
Finally, we utilize legend() with the placeholder plot handles p and assign custom labels 'Cos1', 'Cos2', and 'Cos3' to create the desired custom legends. The legends appear on the plot even though the placeholder plots themselves are not visible due to the undefined values.
This technique enables the creation of multiple legends associated with a single plot, offering flexibility in legend customization within MATLAB.
Add Custom Legends Using the text() Function in MATLAB
Adding custom legends to a plot can also be achieved using the text() function. This function allows you to insert text at specified coordinates on the plot.
The basic syntax for the text() function is as follows:
text(x, y, str)
Where:
xis the x-coordinate where the text will be placed.yis the y-coordinate where the text will be placed.stris the text string you want to display.
You can also specify additional optional parameters to customize the appearance of the text. Here’s an extended version of the syntax:
text(x, y, str, 'PropertyName', PropertyValue, ...)
Where:
'PropertyName'is the name of the property you want to set (e.g.,'FontSize','Color','FontWeight', etc.).PropertyValueis the value you want to set for the corresponding property.
You can include multiple property-value pairs to customize various aspects of the text, such as font size, color, rotation, etc. Let’s demonstrate this with an example.
Customize Text Properties
Note that you need to specify the x and y coordinates where you want the text to be placed. Ensure that these coordinates lie within the plot area; otherwise, the text won’t be visible.
t = 1:0.01:2;
plot(cos(2*pi*t))
t = text(100,0.8,'Cos1','FontSize',18,'Color','r');
Output:
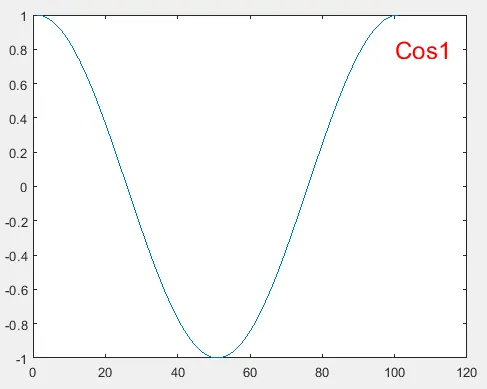
In this example, a cosine wave is plotted, and the text() function is used to place the text Cos1 at coordinates (100, 0.8) with a font size of 18 and in red color.
You can further customize the appearance of the text by adjusting its properties, such as font size (FontSize) and color (Color).
Add Lines and Boxes
To enhance the legend, lines or boxes can be added. For example, you can add a blue line before the text and a black box around the text and the line:
t = 1:0.01:2;
plot(cos(2*pi*t))
tex = text(95,0.8,'{\color{blue} ---} Cos','FontSize',18,'Color','k','EdgeColor','k')
Output:
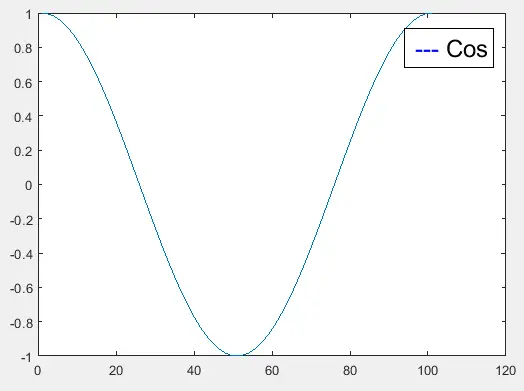
In this example, a blue line ({\color{blue} ---}) is added before the text, and a black box is drawn around both the line and the text.
Add Multiple Text Elements
Furthermore, you can add multiple texts at different positions on the plot, each with its styling. For instance, let’s add another text with a different line style, color, and a box:
t = 1:0.01:2;
plot(cos(2*pi*t))
tex1 = text(95,0.8,'{\color{blue} ---} Cos','FontSize',18,'Color','k','EdgeColor','k')
tex2 = text(89,0.4,'{\color{red} *} Cosine','FontSize',18,'Color','g','EdgeColor','y')
Output:
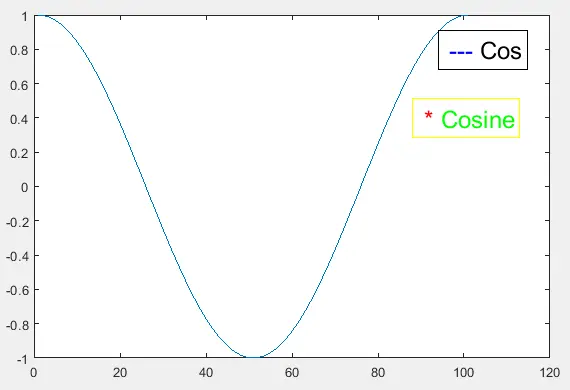
This adds another text with a red asterisk (*) and the text Cosine with a green color and a yellow box.
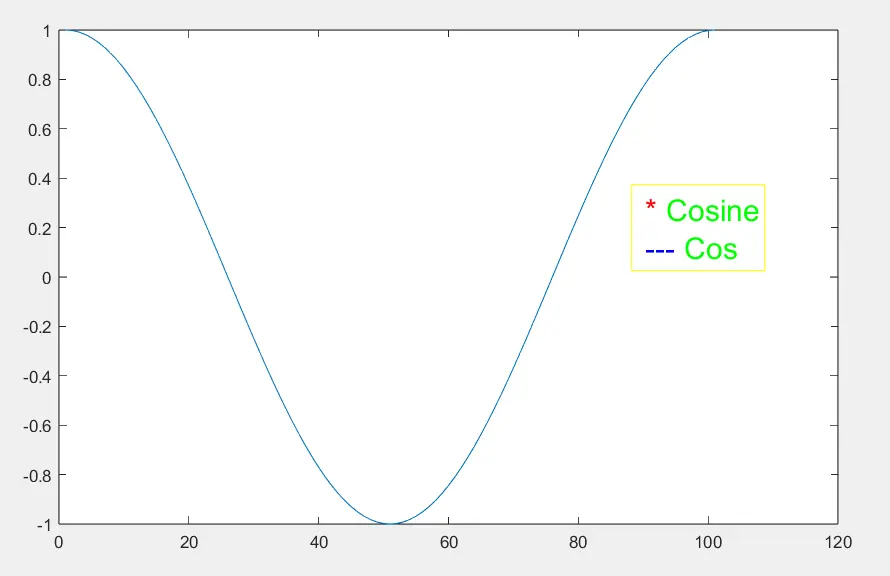
Add Multiple Strings in the Same Box
Multiple strings can be added within the same box by organizing them in a cell array and passing it to the text() function. This allows for a more organized and visually appealing legend.
t = 1:0.01:2;
plot(cos(2*pi*t))
tex3 = text(89,0.2,{'{\color{red} *} Cosine','{\color{blue} ---} Cos'},'FontSize',18,'Color','g','EdgeColor','y');
Output:
By following these steps and customizing the properties, you can create informative and visually appealing legends for your MATLAB plots using the text() function. For more information and additional options, refer to the official MATLAB documentation on the text() function.
Conclusion
Customizing legends is essential for effectively conveying information in MATLAB plots.
While the legend() function provides a straightforward way to add legends, its limitation in handling multiple legends can be overcome using placeholder plots. By creating dummy plots and associating custom labels, you can achieve the desired multiple legends with ease.
Additionally, the text() function offers a flexible approach to custom legend creation, allowing for precise placement and style customization. By leveraging the capabilities of both functions, you can craft visually appealing and informative legends that complement your plots and enhance the overall understanding of the data being presented.
Whether you prefer the simplicity of legend() or the fine-grained control of text(), the ability to tailor your legends will undoubtedly elevate your data representation and storytelling capabilities.
