How to Create Grouped Boxplots in R
-
Use the
fillParameter in theggplotFunction to Create Grouped Boxplots in R -
Use the
facet_wrapFunction to Construct Grouped Boxplots in R
This article will demonstrate multiple methods about how to create grouped boxplots in R.
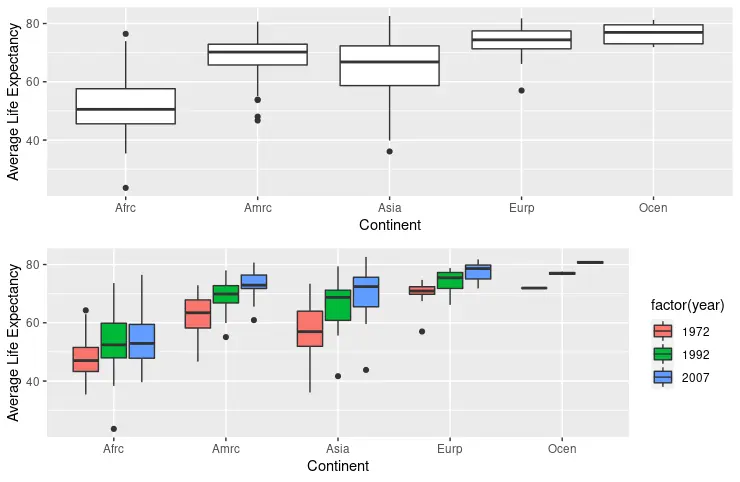
Use the fill Parameter in the ggplot Function to Create Grouped Boxplots in R
The ggplot function together with geom_boxplot is generally used to construct boxplot objects. The first parameter of the ggplot function represents the data set to be used, while the second parameter specifies the list of aesthetic mappings. The aes function maps x and y arguments to the continent and lifeExp columns from the gapminder data set, filtered using the dplyr package functions in the beginning. Then fill parameter maps the year column data and draws yearly boxplots for each continent. The year data should be converted to factor before assigning to the fill parameter; otherwise, the drawn plot does not affect grouping.
library(ggplot2)
library(gridExtra)
library(gapminder)
library(dplyr)

dat <- gapminder %>%
  filter(year %in% c(1972, 1992, 2007))

p1 <- ggplot(dat, aes(x = continent, y = lifeExp, fill = year)) +
  geom_boxplot() +
  scale_y_continuous(name = "Average Life Expectancy") +
  scale_x_discrete(labels = abbreviate, name = "Continent")

p2 <- ggplot(dat, aes(x = continent, y = lifeExp, fill = factor(year))) +
  geom_boxplot() +
  scale_y_continuous(name = "Average Life Expectancy") +
  scale_x_discrete(labels = abbreviate, name = "Continent")

grid.arrange(p1, p2, nrow = 2)
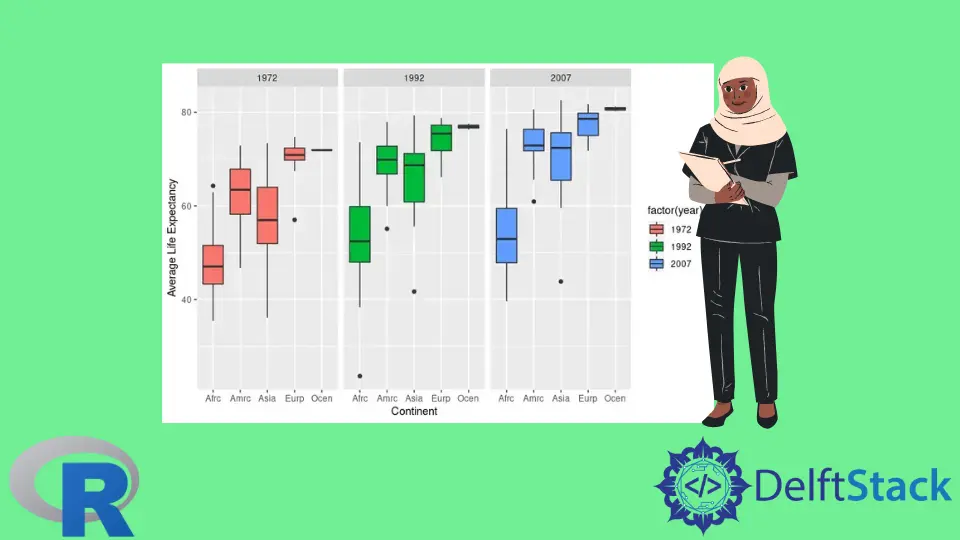
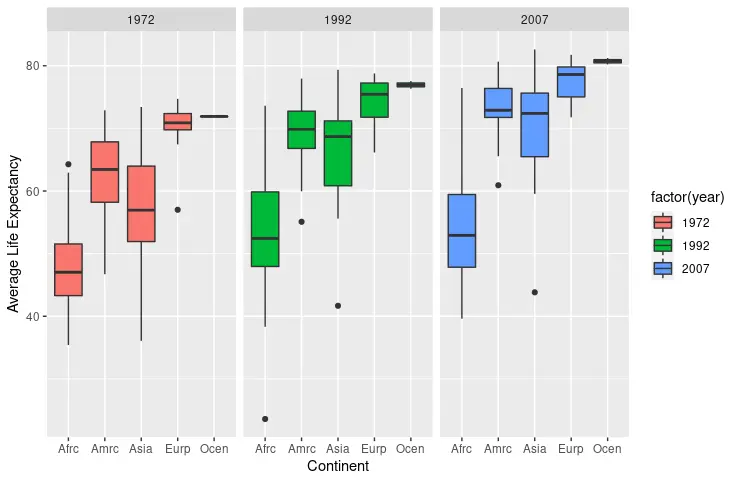
Use the facet_wrap Function to Construct Grouped Boxplots in R
The facet_wrap function is another option to draw multiple boxplots grouped by the specific parameter. In this case, we demonstrate the yearly grouping of the plots. Note that facet_wrap can work without specifying the fill parameter, but it helps distinguish different plots by colors as outputted using the following code snippet. scale_x_discrete and scale_y_continuous are also utilized to modify labels and axis names.
library(ggplot2)
library(gridExtra)
library(gapminder)
library(dplyr)

dat <- gapminder %>%
  filter(year %in% c(1972, 1992, 2007))

p3 <- ggplot(dat, aes(x = continent, y = lifeExp, fill = factor(year))) +
  geom_boxplot() +
  facet_wrap(~year) +
  scale_y_continuous(name = "Average Life Expectancy") +
  scale_x_discrete(labels = abbreviate, name = "Continent")

p3
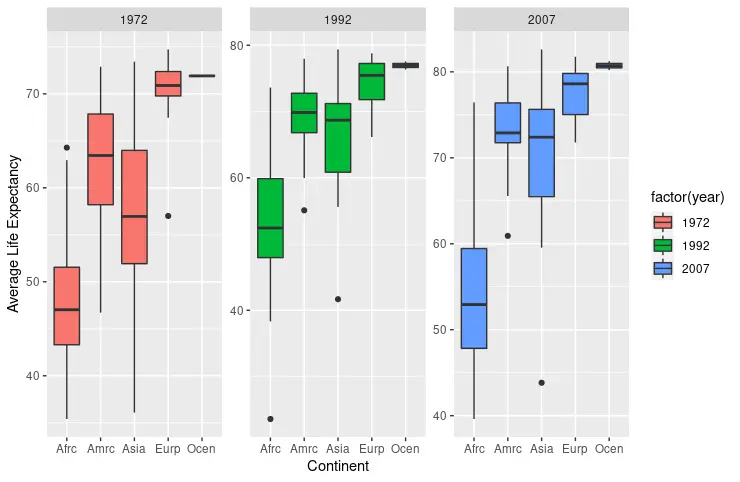
facet_wrap displays the same scales in different plots. Although we can assign free string to scale parameter, that results in automatically adjusted scales.
library(ggplot2)
library(gridExtra)
library(gapminder)
library(dplyr)

dat <- gapminder %>%
  filter(year %in% c(1972, 1992, 2007))

p4 <- ggplot(dat, aes(x = continent, y = lifeExp, fill = factor(year))) +
  geom_boxplot() +
  facet_wrap(~year, scale = "free") +
  scale_y_continuous(name = "Average Life Expectancy") +
  scale_x_discrete(labels = abbreviate, name = "Continent")

p4
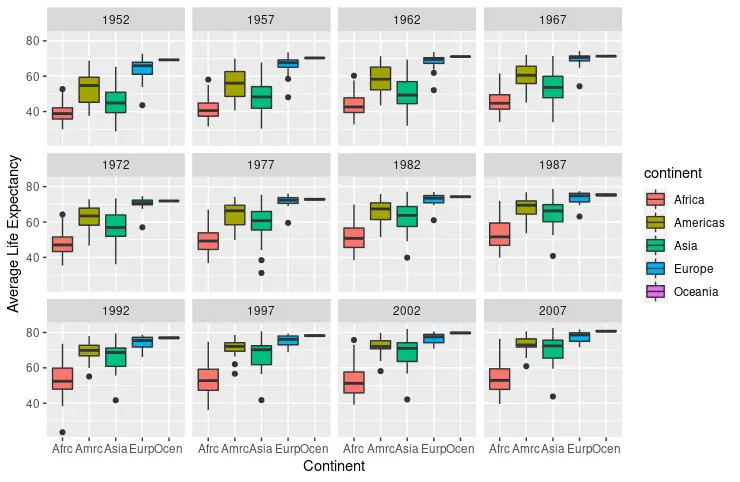
One could also construct yearly boxplots from the unfiltered gapminder data set. This time, the fill parameter has the continent column mapped, and the facet_wrap function takes year data again.
library(ggplot2)
library(gridExtra)
library(gapminder)
library(dplyr)

p5 <- ggplot(gapminder, aes(x = continent, y = lifeExp, fill = continent)) +
  facet_wrap(~year) +
  geom_boxplot() +
  scale_y_continuous(name = "Average Life Expectancy") +
  scale_x_discrete(labels = abbreviate, name = "Continent")

p5

Founder of DelftStack.com. Jinku has worked in the robotics and automotive industries for over 8 years. He sharpened his coding skills when he needed to do the automatic testing, data collection from remote servers and report creation from the endurance test. He is from an electrical/electronics engineering background but has expanded his interest to embedded electronics, embedded programming and front-/back-end programming.
LinkedIn Facebook