Criar Boxplots Agrupados em R
-
Use o parâmetro
fillna funçãoggplotpara criar boxplots agrupados em R -
Use a função
facet_wrappara construir boxplots agrupados em R
Este artigo demonstrará vários métodos sobre como criar boxplots agrupados em R.
Use o parâmetro fill na função ggplot para criar boxplots agrupados em R
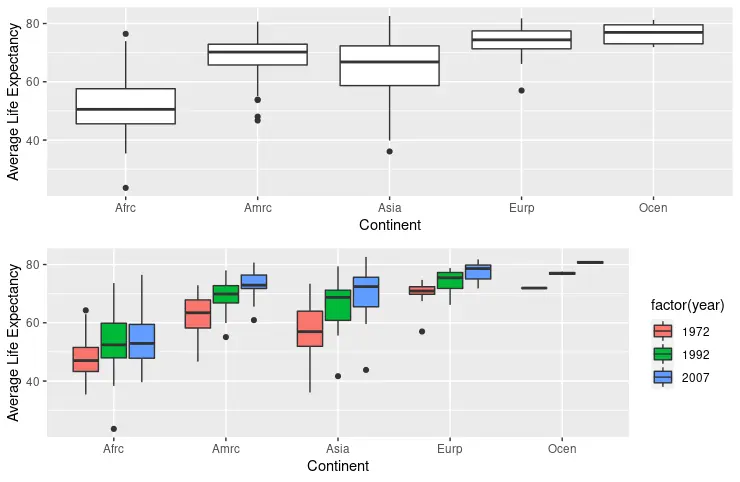
A função ggplot junto com geom_boxplot é geralmente usada para construir objetos de boxplot. O primeiro parâmetro da função ggplot representa o conjunto de dados a ser usado, enquanto o segundo parâmetro especifica a lista de mapeamentos estéticos. A função aes mapeia os argumentos x e y para as colunas continent e lifeExp do conjunto de dados gapminder, filtrado usando as funções de pacote dplyr no início. Em seguida, o parâmetro fill mapeia os dados da coluna year e desenha boxplots anuais para cada continente. Os dados year devem ser convertidos para factor antes de serem atribuídos ao parâmetro fill; caso contrário, o gráfico desenhado não afeta o agrupamento.
library(ggplot2)
library(gridExtra)
library(gapminder)
library(dplyr)

dat <- gapminder %>%
  filter(year %in% c(1972, 1992, 2007))

p1 <- ggplot(dat, aes(x = continent, y = lifeExp, fill = year)) +
  geom_boxplot() +
  scale_y_continuous(name = "Average Life Expectancy") +
  scale_x_discrete(labels = abbreviate, name = "Continent")

p2 <- ggplot(dat, aes(x = continent, y = lifeExp, fill = factor(year))) +
  geom_boxplot() +
  scale_y_continuous(name = "Average Life Expectancy") +
  scale_x_discrete(labels = abbreviate, name = "Continent")

grid.arrange(p1, p2, nrow = 2)
Use a função facet_wrap para construir boxplots agrupados em R
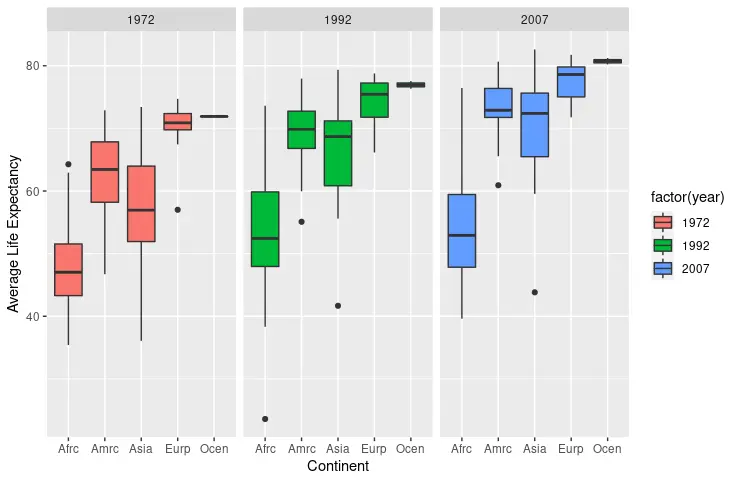
A função facet_wrap é outra opção para desenhar múltiplos boxplots agrupados pelo parâmetro específico. Nesse caso, demonstramos o agrupamento anual das parcelas. Observe que facet_wrap pode funcionar sem especificar o parâmetro fill, mas ajuda a distinguir diferentes plotagens por cores conforme a saída usando o seguinte trecho de código. scale_x_discrete e scale_y_continuous também são utilizados para modificar rótulos e nomes de eixos.
library(ggplot2)
library(gridExtra)
library(gapminder)
library(dplyr)

dat <- gapminder %>%
  filter(year %in% c(1972, 1992, 2007))

p3 <- ggplot(dat, aes(x = continent, y = lifeExp, fill = factor(year))) +
  geom_boxplot() +
  facet_wrap(~year) +
  scale_y_continuous(name = "Average Life Expectancy") +
  scale_x_discrete(labels = abbreviate, name = "Continent")

p3
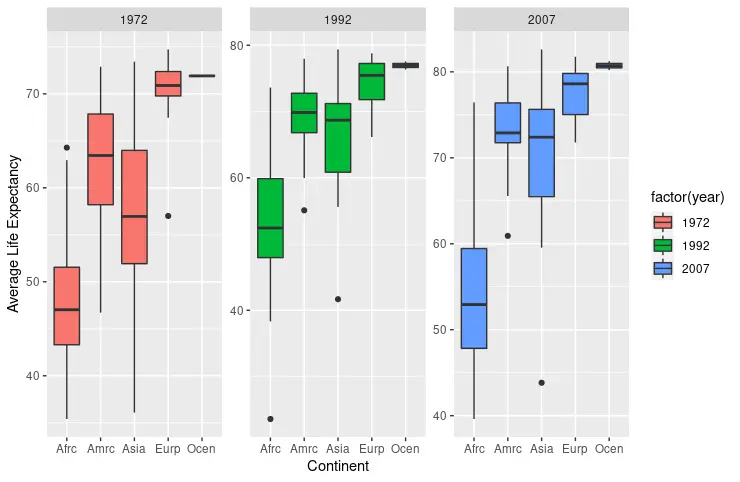
facet_wrap exibe as mesmas escalas em gráficos diferentes. Embora possamos atribuir string free ao parâmetro scale, isso resulta em escalas ajustadas automaticamente.
library(ggplot2)
library(gridExtra)
library(gapminder)
library(dplyr)

dat <- gapminder %>%
  filter(year %in% c(1972, 1992, 2007))

p4 <- ggplot(dat, aes(x = continent, y = lifeExp, fill = factor(year))) +
  geom_boxplot() +
  facet_wrap(~year, scale = "free") +
  scale_y_continuous(name = "Average Life Expectancy") +
  scale_x_discrete(labels = abbreviate, name = "Continent")

p4
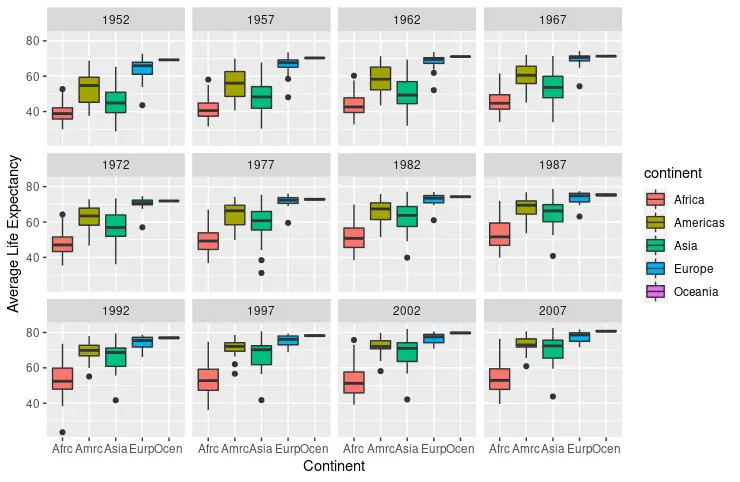
Também é possível construir boxplots anuais a partir do conjunto de dados gapminder não filtrado. Desta vez, o parâmetro fill possui a coluna continent mapeada e a função facet_wrap obtém os dados year novamente.
library(ggplot2)
library(gridExtra)
library(gapminder)
library(dplyr)

p5 <- ggplot(gapminder, aes(x = continent, y = lifeExp, fill = continent)) +
  facet_wrap(~year) +
  geom_boxplot() +
  scale_y_continuous(name = "Average Life Expectancy") +
  scale_x_discrete(labels = abbreviate, name = "Continent")

p5

Founder of DelftStack.com. Jinku has worked in the robotics and automotive industries for over 8 years. He sharpened his coding skills when he needed to do the automatic testing, data collection from remote servers and report creation from the endurance test. He is from an electrical/electronics engineering background but has expanded his interest to embedded electronics, embedded programming and front-/back-end programming.
LinkedIn Facebook