R에서 그룹화 된 상자 그림 만들기
이 문서에서는 R에서 그룹화 된 상자 그림을 만드는 방법에 대한 여러 방법을 보여줍니다.
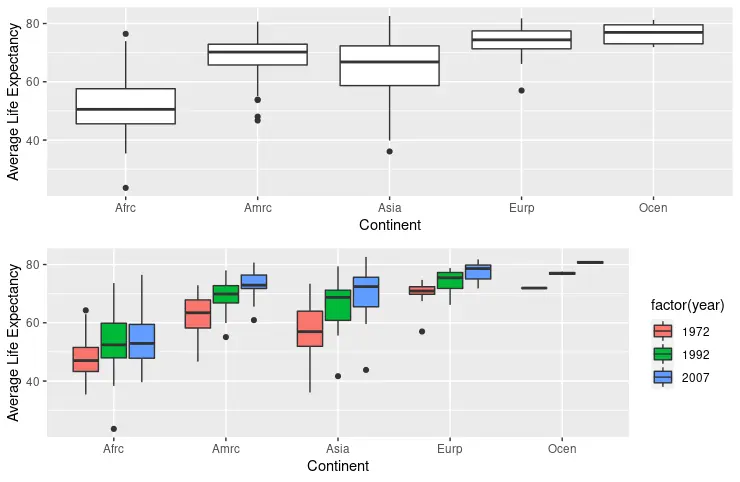
ggplot함수에서fill매개 변수를 사용하여 R에서 그룹화 된 상자 그림 만들기
geom_boxplot과 함께ggplot함수는 일반적으로 boxplot 객체를 생성하는 데 사용됩니다. ggplot함수의 첫 번째 매개 변수는 사용할 데이터 세트를 나타내고 두 번째 매개 변수는 미적 매핑 목록을 지정합니다. aes함수는 처음에dplyr패키지 함수를 사용하여 필터링 된gapminder데이터 세트의continent및lifeExp열에x및y인수를 매핑합니다. 그런 다음fill매개 변수가연도열 데이터를 매핑하고 각 대륙에 대한 연간 상자 그림을 그립니다. 연도데이터는fill매개 변수에 할당하기 전에factor로 변환해야합니다. 그렇지 않으면 그려진 플롯이 그룹화에 영향을주지 않습니다.
library(ggplot2)
library(gridExtra)
library(gapminder)
library(dplyr)

dat <- gapminder %>%
  filter(year %in% c(1972, 1992, 2007))

p1 <- ggplot(dat, aes(x = continent, y = lifeExp, fill = year)) +
  geom_boxplot() +
  scale_y_continuous(name = "Average Life Expectancy") +
  scale_x_discrete(labels = abbreviate, name = "Continent")

p2 <- ggplot(dat, aes(x = continent, y = lifeExp, fill = factor(year))) +
  geom_boxplot() +
  scale_y_continuous(name = "Average Life Expectancy") +
  scale_x_discrete(labels = abbreviate, name = "Continent")

grid.arrange(p1, p2, nrow = 2)
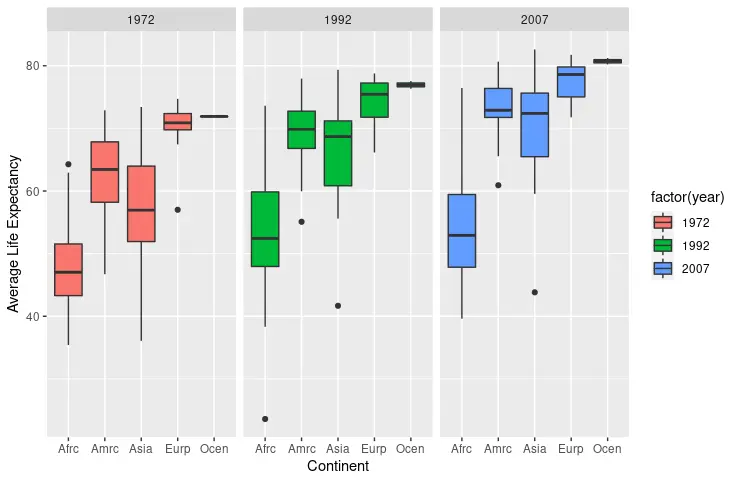
facet_wrap함수를 사용하여 R에서 그룹화 된 상자 그림 생성
facet_wrap함수는 특정 매개 변수로 그룹화 된 여러 상자 그림을 그리는 또 다른 옵션입니다. 이 경우 연간 플롯 그룹화를 보여줍니다. facet_wrap은fill매개 변수를 지정하지 않고도 작동 할 수 있지만 다음 코드 스 니펫을 사용하여 출력 된대로 색상별로 다른 플롯을 구별하는 데 도움이됩니다. scale_x_discrete및scale_y_continuous도 레이블 및 축 이름을 수정하는 데 사용됩니다.
library(ggplot2)
library(gridExtra)
library(gapminder)
library(dplyr)

dat <- gapminder %>%
  filter(year %in% c(1972, 1992, 2007))

p3 <- ggplot(dat, aes(x = continent, y = lifeExp, fill = factor(year))) +
  geom_boxplot() +
  facet_wrap(~year) +
  scale_y_continuous(name = "Average Life Expectancy") +
  scale_x_discrete(labels = abbreviate, name = "Continent")

p3
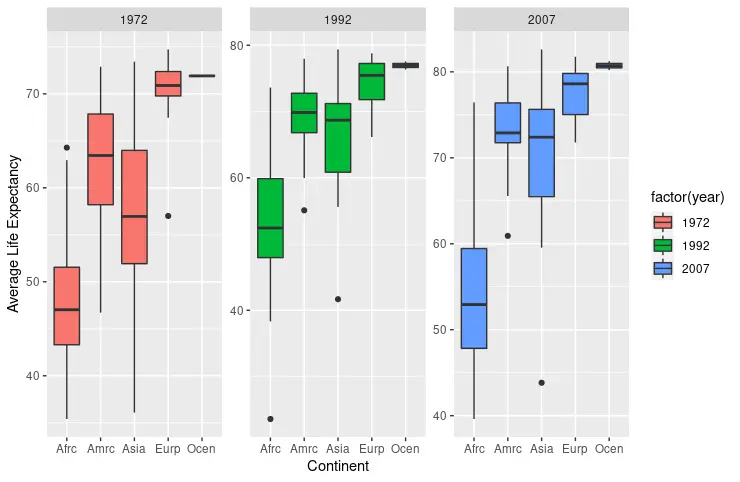
facet_wrap은 다른 플롯에서 동일한 스케일을 표시합니다. scale 매개 변수에free 문자열을 할당 할 수 있지만 그 결과 자동으로 조정 된 스케일이 생성됩니다.
library(ggplot2)
library(gridExtra)
library(gapminder)
library(dplyr)

dat <- gapminder %>%
  filter(year %in% c(1972, 1992, 2007))

p4 <- ggplot(dat, aes(x = continent, y = lifeExp, fill = factor(year))) +
  geom_boxplot() +
  facet_wrap(~year, scale = "free") +
  scale_y_continuous(name = "Average Life Expectancy") +
  scale_x_discrete(labels = abbreviate, name = "Continent")

p4
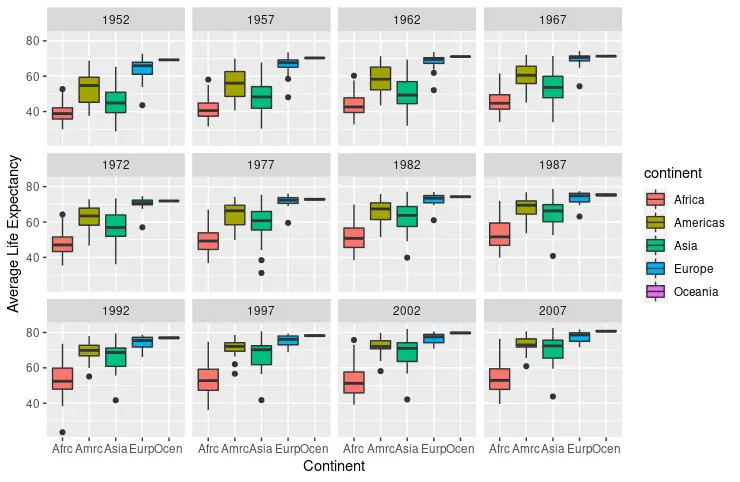
필터링되지 않은gapminder데이터 세트에서 연간 상자 그림을 구성 할 수도 있습니다. 이번에는fill매개 변수에continent열이 매핑되고facet_wrap함수는year데이터를 다시 사용합니다.
library(ggplot2)
library(gridExtra)
library(gapminder)
library(dplyr)

p5 <- ggplot(gapminder, aes(x = continent, y = lifeExp, fill = continent)) +
  facet_wrap(~year) +
  geom_boxplot() +
  scale_y_continuous(name = "Average Life Expectancy") +
  scale_x_discrete(labels = abbreviate, name = "Continent")

p5

Founder of DelftStack.com. Jinku has worked in the robotics and automotive industries for over 8 years. He sharpened his coding skills when he needed to do the automatic testing, data collection from remote servers and report creation from the endurance test. He is from an electrical/electronics engineering background but has expanded his interest to embedded electronics, embedded programming and front-/back-end programming.
LinkedIn Facebook