在 R 中建立分組箱線圖
本文將演示有關如何在 R 中建立分組箱線圖的多種方法。
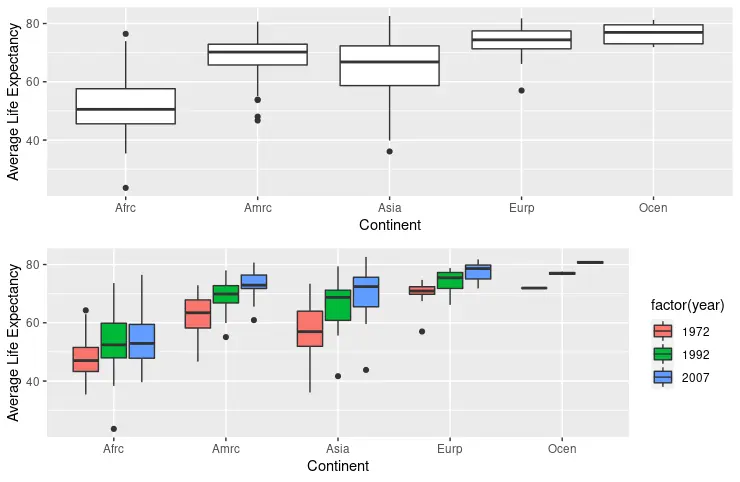
在 R 中使用 ggplot 函式中的 fill 引數建立分組箱線圖
ggplot 函式和 geom_boxplot 通常用於構造箱線圖物件。ggplot 函式的第一個參數列示要使用的資料集,而第二個引數指定美學對映列表。aes 函式將 x 和 y 引數對映到 gapminder 資料集中的 continent 和 lifeExp 列,在開始時使用 dplyr 包函式過濾。然後 fill 引數對映 year 列資料並繪製每個大陸的年度箱線圖。在分配給 fill 引數之前,應將 year 資料轉換為 factor;否則,繪製的圖不影響分組。
library(ggplot2)
library(gridExtra)
library(gapminder)
library(dplyr)

dat <- gapminder %>%
  filter(year %in% c(1972, 1992, 2007))

p1 <- ggplot(dat, aes(x = continent, y = lifeExp, fill = year)) +
  geom_boxplot() +
  scale_y_continuous(name = "Average Life Expectancy") +
  scale_x_discrete(labels = abbreviate, name = "Continent")

p2 <- ggplot(dat, aes(x = continent, y = lifeExp, fill = factor(year))) +
  geom_boxplot() +
  scale_y_continuous(name = "Average Life Expectancy") +
  scale_x_discrete(labels = abbreviate, name = "Continent")

grid.arrange(p1, p2, nrow = 2)
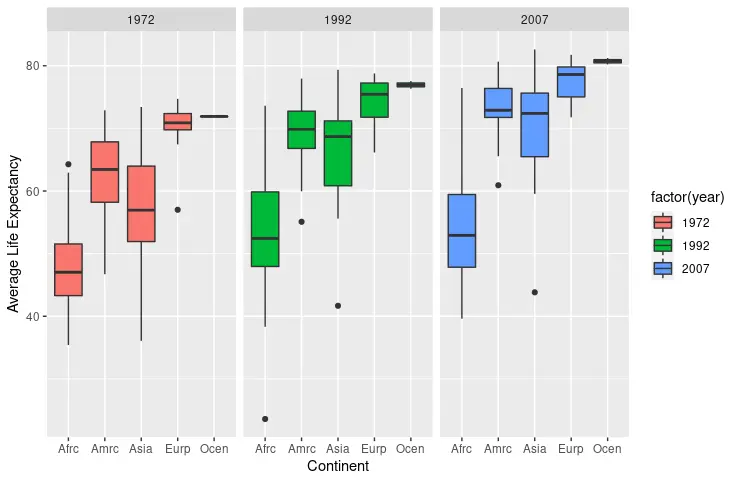
在 R 中使用 facet_wrap 函式構建分組箱線圖
facet_wrap 函式是繪製按特定引數分組的多個箱線圖的另一種選擇。在這種情況下,我們展示了圖的年度分組。請注意,facet_wrap 可以在不指定 fill 引數的情況下工作,但它有助於通過使用以下程式碼片段輸出的顏色區分不同的圖。scale_x_discrete 和 scale_y_continuous 也用於修改標籤和軸名稱。
library(ggplot2)
library(gridExtra)
library(gapminder)
library(dplyr)

dat <- gapminder %>%
  filter(year %in% c(1972, 1992, 2007))

p3 <- ggplot(dat, aes(x = continent, y = lifeExp, fill = factor(year))) +
  geom_boxplot() +
  facet_wrap(~year) +
  scale_y_continuous(name = "Average Life Expectancy") +
  scale_x_discrete(labels = abbreviate, name = "Continent")

p3
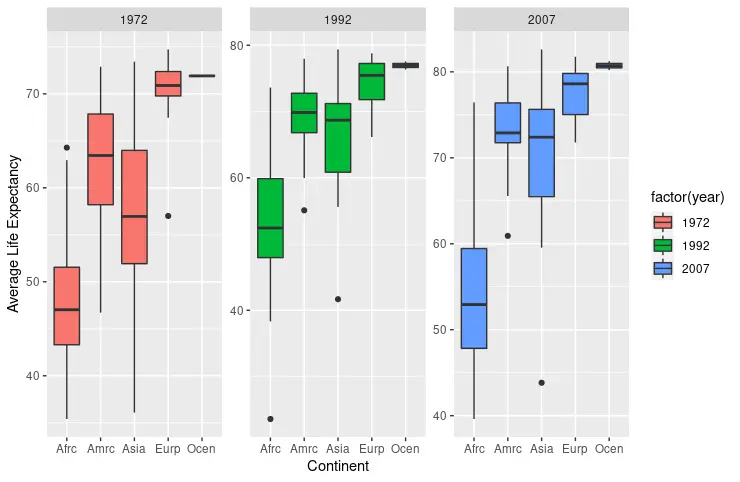
facet_wrap 在不同的圖中顯示相同的比例。儘管我們可以將 free 字串分配給 scale 引數,這會導致自動調整比例。
library(ggplot2)
library(gridExtra)
library(gapminder)
library(dplyr)

dat <- gapminder %>%
  filter(year %in% c(1972, 1992, 2007))

p4 <- ggplot(dat, aes(x = continent, y = lifeExp, fill = factor(year))) +
  geom_boxplot() +
  facet_wrap(~year, scale = "free") +
  scale_y_continuous(name = "Average Life Expectancy") +
  scale_x_discrete(labels = abbreviate, name = "Continent")

p4
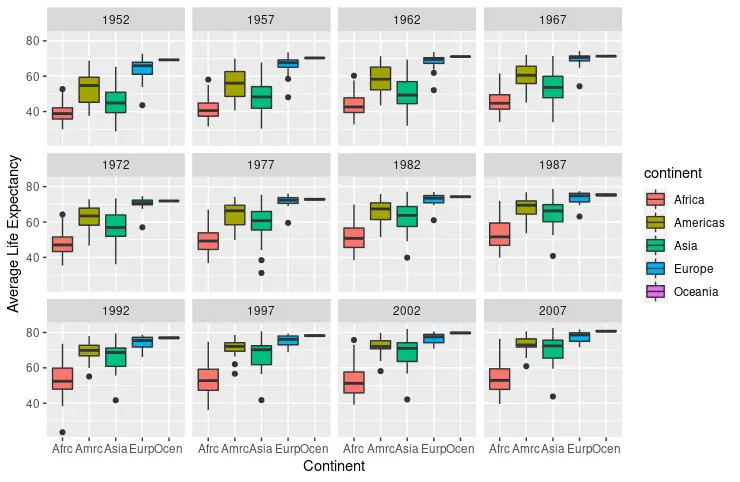
還可以從未過濾的 gapminder 資料集構建年度箱線圖。這一次,fill 引數對映了 continent 列,而 facet_wrap 函式再次獲取 year 資料。
library(ggplot2)
library(gridExtra)
library(gapminder)
library(dplyr)

p5 <- ggplot(gapminder, aes(x = continent, y = lifeExp, fill = continent)) +
  facet_wrap(~year) +
  geom_boxplot() +
  scale_y_continuous(name = "Average Life Expectancy") +
  scale_x_discrete(labels = abbreviate, name = "Continent")

p5
Enjoying our tutorials? Subscribe to DelftStack on YouTube to support us in creating more high-quality video guides. Subscribe
作者: Jinku Hu
