How to Apply Subplot Title in MATLAB
-
Add a Title to a Group of Subplots Using the
sgtitle()Function in MATLAB -
Add a Title to a Group of Subplots Using the
suptitle()Function in MATLAB

This tutorial will discuss how to add a title to a group of subplots using the sgtitle() and suptitle() function in MATLAB.
Add a Title to a Group of Subplots Using the sgtitle() Function in MATLAB
If you have a group of subplots and want to add a title over all the subplots, you can use the sgtitle() function, which adds the given string above all the subplots on a given figure. You can also change the font size of the text using the FontSize property, the color of the text using the Color property, and the name of the font using the FontName property. For example, let’s plot two subplots of sine and cosine waves on a figure and put a title above the two subplots. See the code below.
t = 1:0.01:2;
x = sin(2*pi*t);
y = cos(2*pi*t);
figure
subplot(1,2,1)
plot(t,x)
title('Sine Wave')
subplot(1,2,2)
plot(t,y)
title('Cosine Wave')
sgtitle('Two Subplots')
Output:
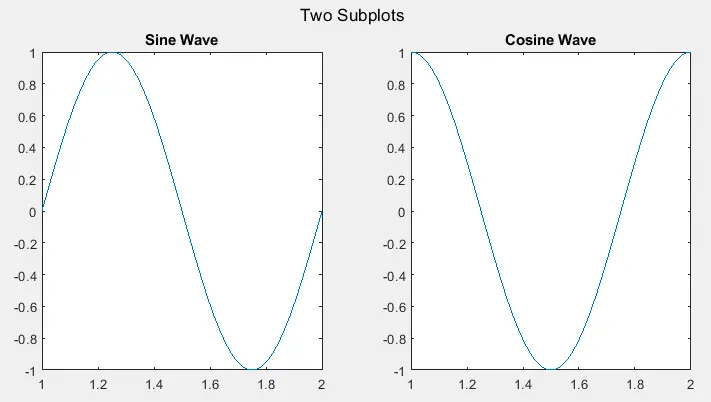
In the above code, we used the subplot() function to plot two signals in a figure, and we used the title() function to give a title to each subplot and we used the sgtitle() function to add a title over both subplots. Now let’s change the font size of the title to 28 using the FontSize property, the name of the font to Times New Roman using the FontName property, and the color of the title to red using the Color property. See the code below.
t = 1:0.01:2;
x = sin(2*pi*t);
y = cos(2*pi*t);
figure
subplot(1,2,1)
plot(t,x)
title('Sine Wave')
subplot(1,2,2)
plot(t,y)
title('Cosine Wave')
sgtitle('Two Subplots','FontSize',28,'FontName','Times New Roman','Color','r')
Output:
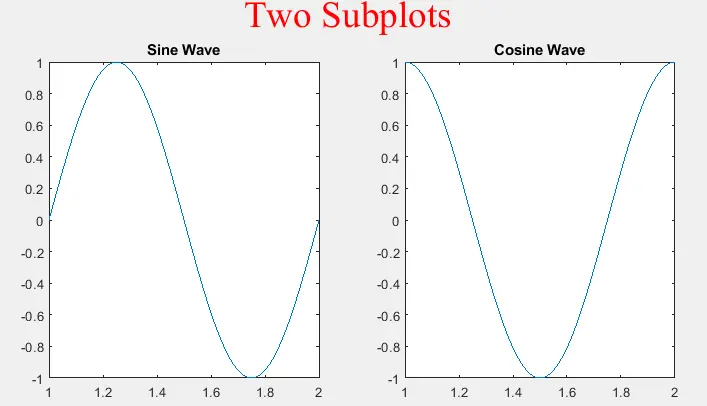
In the above figure, you can see the font size, font name, and the color of the title are changed. You can change these properties according to your requirements. Check this link for more details about the sgtitle() function.
Add a Title to a Group of Subplots Using the suptitle() Function in MATLAB
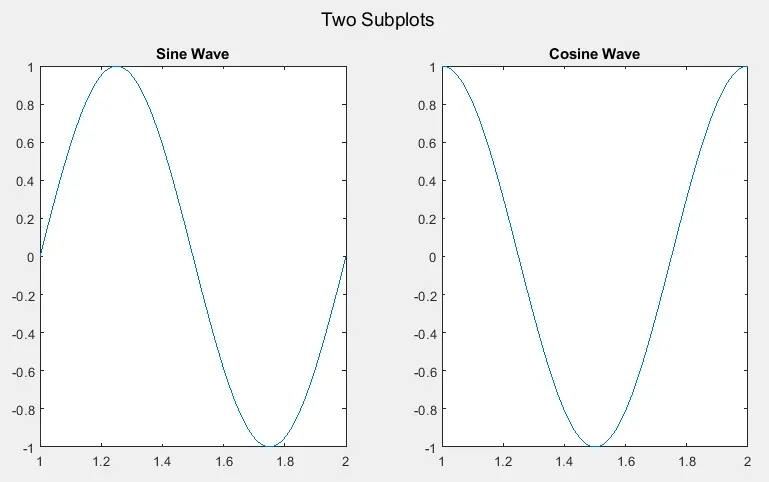
You can also use the suptitle() function which adds the given text above all the subplots on a given figure. You can also change the font size of the text using the FontSize property, the color of the text using the Color property, and the name of the font using the FontName property. For example, let’s plot two subplots of sine and cosine waves on a figure and put a title above the two subplots. See the code below.
t = 1:0.01:2;
x = sin(2*pi*t);
y = cos(2*pi*t);
figure
subplot(1,2,1)
plot(t,x)
title('Sine Wave')
subplot(1,2,2)
plot(t,y)
title('Cosine Wave')
suptitle('Two Subplots')
Output:
Now let’s change the font size of the title to 18 using the FontSize property, the name of the font to Calibri using the FontName property, and the color of the title to green using the Color property. See the code below.
t = 1:0.01:2;
x = sin(2*pi*t);
y = cos(2*pi*t);
figure
subplot(1,2,1)
plot(t,x)
title('Sine Wave')
subplot(1,2,2)
plot(t,y)
title('Cosine Wave')
t1 = suptitle('Two Subplots')
t1.FontSize = 18;
t1.Color = 'g';
t1.FontName  = 'Calibri'
Output:
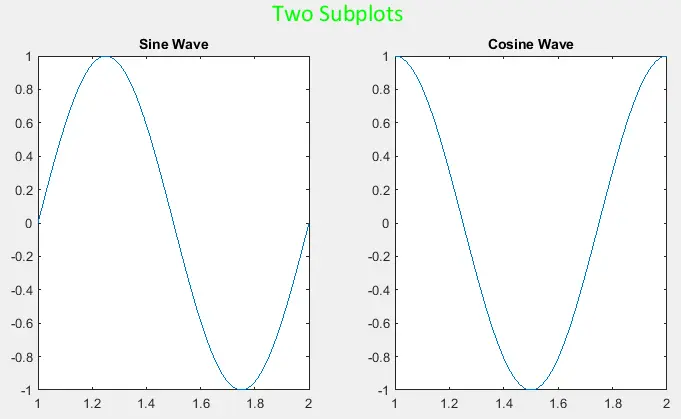
In the above figure, you can see the font size, font name, and the color of the title are changed. You can change these properties according to your requirements using the function handle t1.
