MATLAB サブプロットタイトル

このチュートリアルでは、MATLAB の sgtitle() および suptitle() 関数を使用して、サブプロットのグループにタイトルを追加する方法について説明します。
MATLAB の sgtitle() 関数を使用して、サブプロットのグループにタイトルを追加する
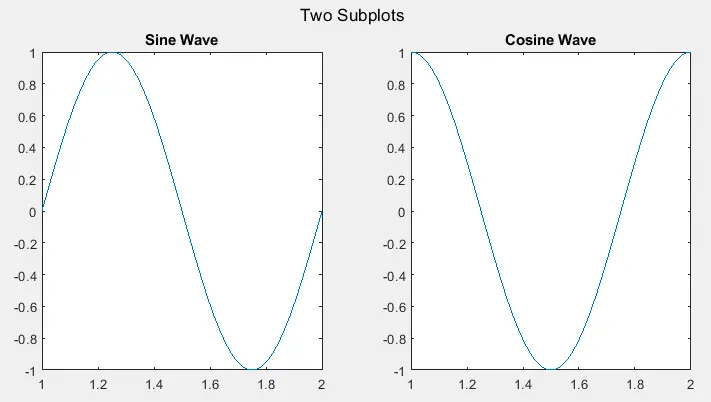
サブプロットのグループがあり、すべてのサブプロットにタイトルを追加する場合は、sgtitle() 関数を使用できます。この関数は、特定の図のすべてのサブプロットの上に特定の文字列を追加します。FontSize プロパティを使用してテキストのフォントサイズを変更したり、Color プロパティを使用してテキストの色を変更したり、FontName プロパティを使用してフォントの名前を変更したりすることもできます。たとえば、正弦波と余弦波の 2つのサブプロットを図にプロットし、2つのサブプロットの上にタイトルを付けてみましょう。以下のコードを参照してください。
t = 1:0.01:2;
x = sin(2*pi*t);
y = cos(2*pi*t);
figure
subplot(1,2,1)
plot(t,x)
title('Sine Wave')
subplot(1,2,2)
plot(t,y)
title('Cosine Wave')
sgtitle('Two Subplots')
出力:
上記のコードでは、subplot() 関数を使用して図に 2つの信号をプロットし、title() 関数を使用して各サブプロットにタイトルを付け、sgtitle() 関数を使用して両方のサブプロットにタイトルを追加します。次に、FontSize プロパティを使用してタイトルのフォントサイズを 28 に変更し、FontName プロパティを使用してフォントの名前を Times New Roman に変更し、Color プロパティを使用してタイトルの色を赤に変更しましょう。以下のコードを参照してください。
t = 1:0.01:2;
x = sin(2*pi*t);
y = cos(2*pi*t);
figure
subplot(1,2,1)
plot(t,x)
title('Sine Wave')
subplot(1,2,2)
plot(t,y)
title('Cosine Wave')
sgtitle('Two Subplots','FontSize',28,'FontName','Times New Roman','Color','r')
出力:
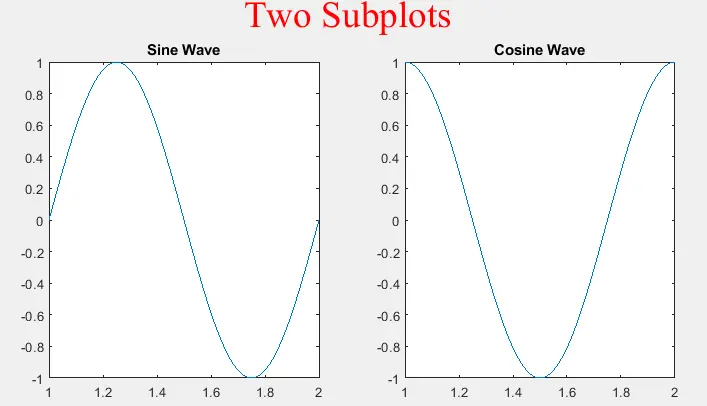
上の図では、フォントサイズ、フォント名、およびタイトルの色が変更されていることがわかります。要件に応じて、これらのプロパティを変更できます。sgtitle() 関数の詳細については、このリンクを確認してください。
MATLAB の suptitle() 関数を使用して、サブプロットのグループにタイトルを追加する
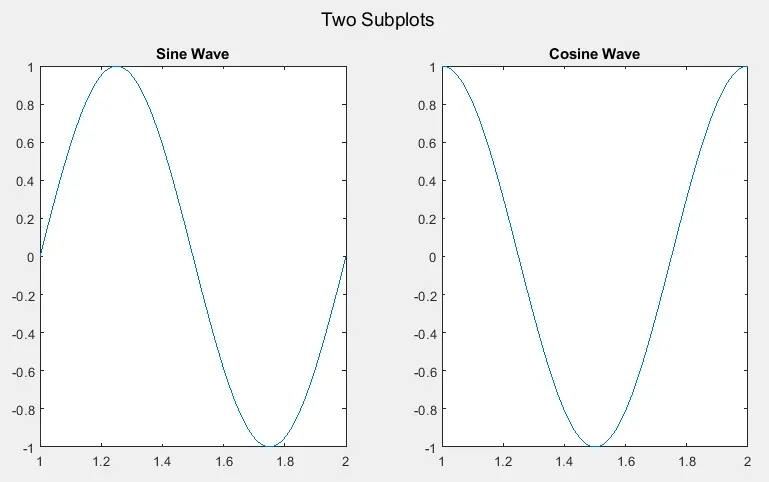
suptitle() 関数を使用して、特定の図のすべてのサブプロットの上に特定のテキストを追加することもできます。FontSize プロパティを使用してテキストのフォントサイズを変更したり、Color プロパティを使用してテキストの色を変更したり、FontName プロパティを使用してフォントの名前を変更したりすることもできます。たとえば、正弦波と余弦波の 2つのサブプロットを図にプロットし、2つのサブプロットの上にタイトルを付けてみましょう。以下のコードを参照してください。
t = 1:0.01:2;
x = sin(2*pi*t);
y = cos(2*pi*t);
figure
subplot(1,2,1)
plot(t,x)
title('Sine Wave')
subplot(1,2,2)
plot(t,y)
title('Cosine Wave')
suptitle('Two Subplots')
出力:
次に、FontSize プロパティを使用してタイトルのフォントサイズを 18 に変更し、FontName プロパティを使用してフォントの名前を Calibri に変更し、Color プロパティを使用してタイトルの色を緑に変更しましょう。以下のコードを参照してください。
t = 1:0.01:2;
x = sin(2*pi*t);
y = cos(2*pi*t);
figure
subplot(1,2,1)
plot(t,x)
title('Sine Wave')
subplot(1,2,2)
plot(t,y)
title('Cosine Wave')
t1 = suptitle('Two Subplots')
t1.FontSize = 18;
t1.Color = 'g';
t1.FontName  = 'Calibri'
出力:
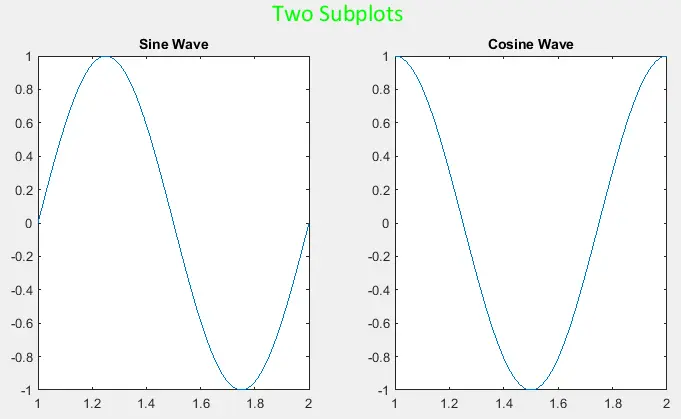
上の図では、フォントサイズ、フォント名、およびタイトルの色が変更されていることがわかります。関数ハンドル t1 を使用して、要件に応じてこれらのプロパティを変更できます。
