MATLAB 子圖示題

本教程將討論如何使用 MATLAB 中的 sgtitle() 和 suptitle() 函式為一組子圖新增標題。
使用 MATLAB 中的 sgtitle() 函式為一組子圖新增標題
如果你有一組子圖並希望在所有子圖上新增標題,你可以使用 sgtitle() 函式,它將給定的字串新增到給定圖形的所有子圖之上。你還可以使用 FontSize 屬性更改文字的字型大小,使用 Color 屬性更改文字的顏色,以及使用 FontName 屬性更改字型的名稱。例如,讓我們在圖形上繪製正弦波和餘弦波的兩個子圖,並在兩個子圖上方放置一個標題。請參考下面的程式碼。
t = 1:0.01:2;
x = sin(2*pi*t);
y = cos(2*pi*t);
figure
subplot(1,2,1)
plot(t,x)
title('Sine Wave')
subplot(1,2,2)
plot(t,y)
title('Cosine Wave')
sgtitle('Two Subplots')
輸出:
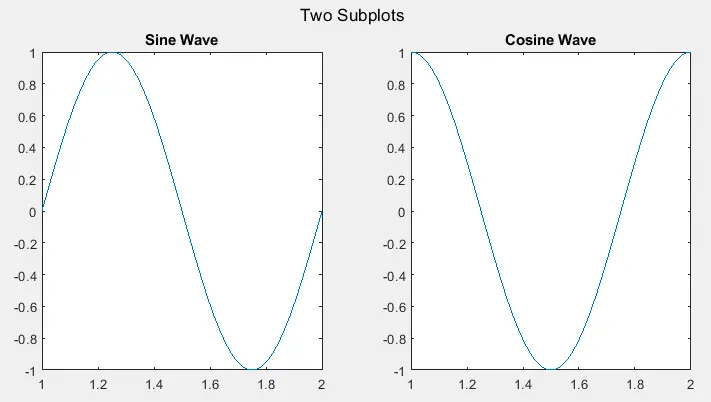
在上面的程式碼中,我們使用 subplot() 函式在圖中繪製兩個訊號,我們使用 title() 函式為每個子圖提供標題,我們使用 sgtitle() 函式來繪製在兩個子圖上新增標題。現在讓我們使用 FontSize 屬性將標題的字型大小更改為 28,使用 FontName 屬性將字型名稱更改為 Times New Roman,使用 Color 屬性將標題顏色更改為紅色。請參考下面的程式碼。
t = 1:0.01:2;
x = sin(2*pi*t);
y = cos(2*pi*t);
figure
subplot(1,2,1)
plot(t,x)
title('Sine Wave')
subplot(1,2,2)
plot(t,y)
title('Cosine Wave')
sgtitle('Two Subplots','FontSize',28,'FontName','Times New Roman','Color','r')
輸出:
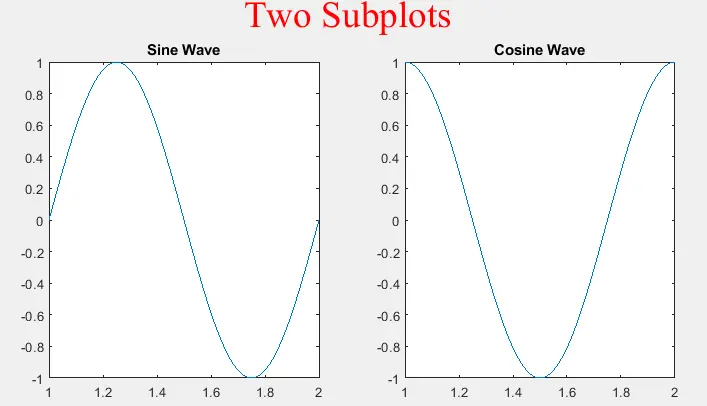
在上圖中,可以看到字型大小、字型名稱和標題顏色都發生了變化。你可以根據需要更改這些屬性。檢視此連結以獲取有關 sgtitle() 函式的更多詳細資訊。
使用 MATLAB 中的 suptitle() 函式為一組子圖新增標題
你還可以使用 suptitle() 函式,該函式將給定文字新增到給定圖形的所有子圖上方。你還可以使用 FontSize 屬性更改文字的字型大小,使用 Color 屬性更改文字的顏色,以及使用 FontName 屬性更改字型的名稱。例如,讓我們在圖形上繪製正弦波和餘弦波的兩個子圖,並在兩個子圖上方放置一個標題。請參考下面的程式碼。
t = 1:0.01:2;
x = sin(2*pi*t);
y = cos(2*pi*t);
figure
subplot(1,2,1)
plot(t,x)
title('Sine Wave')
subplot(1,2,2)
plot(t,y)
title('Cosine Wave')
suptitle('Two Subplots')
輸出:
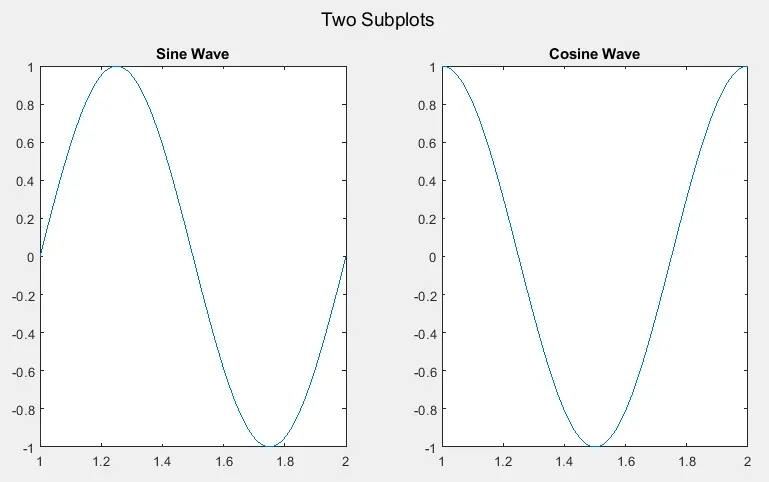
現在讓我們使用 FontSize 屬性將標題的字型大小更改為 18,使用 FontName 屬性將字型名稱更改為 Calibri,使用 Color 屬性將標題顏色更改為綠色。請參考下面的程式碼。
t = 1:0.01:2;
x = sin(2*pi*t);
y = cos(2*pi*t);
figure
subplot(1,2,1)
plot(t,x)
title('Sine Wave')
subplot(1,2,2)
plot(t,y)
title('Cosine Wave')
t1 = suptitle('Two Subplots')
t1.FontSize = 18;
t1.Color = 'g';
t1.FontName  = 'Calibri'
輸出:
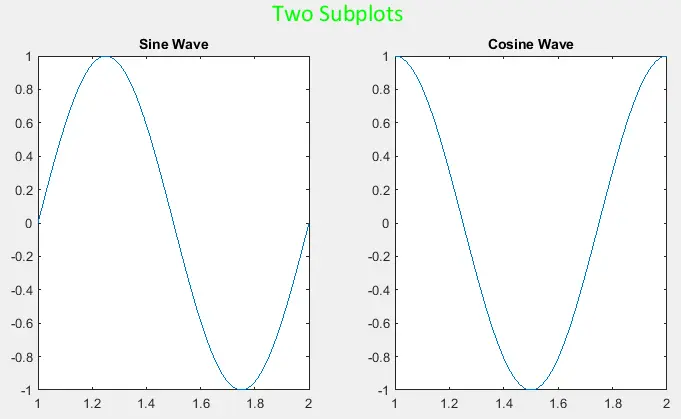
在上圖中,可以看到字型大小、字型名稱和標題顏色都發生了變化。你可以使用函式控制代碼 t1 根據你的要求更改這些屬性。
