MATLAB 子图标题

本教程将讨论如何使用 MATLAB 中的 sgtitle() 和 suptitle() 函数为一组子图添加标题。
使用 MATLAB 中的 sgtitle() 函数为一组子图添加标题
如果你有一组子图并希望在所有子图上添加标题,你可以使用 sgtitle() 函数,它将给定的字符串添加到给定图形的所有子图之上。你还可以使用 FontSize 属性更改文本的字体大小,使用 Color 属性更改文本的颜色,以及使用 FontName 属性更改字体的名称。例如,让我们在图形上绘制正弦波和余弦波的两个子图,并在两个子图上方放置一个标题。请参考下面的代码。
t = 1:0.01:2;
x = sin(2*pi*t);
y = cos(2*pi*t);
figure
subplot(1,2,1)
plot(t,x)
title('Sine Wave')
subplot(1,2,2)
plot(t,y)
title('Cosine Wave')
sgtitle('Two Subplots')
输出:
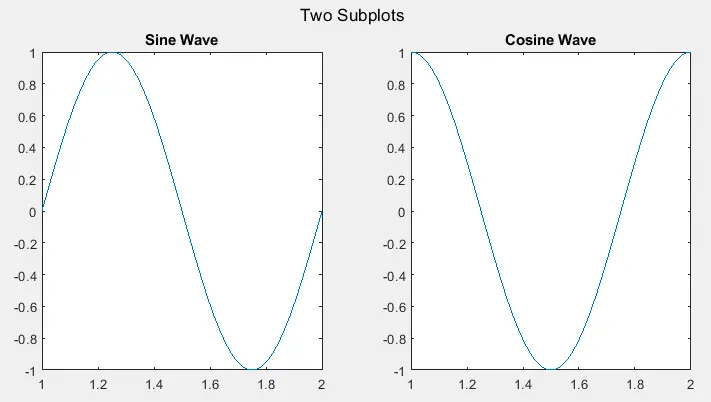
在上面的代码中,我们使用 subplot() 函数在图中绘制两个信号,我们使用 title() 函数为每个子图提供标题,我们使用 sgtitle() 函数来绘制在两个子图上添加标题。现在让我们使用 FontSize 属性将标题的字体大小更改为 28,使用 FontName 属性将字体名称更改为 Times New Roman,使用 Color 属性将标题颜色更改为红色。请参考下面的代码。
t = 1:0.01:2;
x = sin(2*pi*t);
y = cos(2*pi*t);
figure
subplot(1,2,1)
plot(t,x)
title('Sine Wave')
subplot(1,2,2)
plot(t,y)
title('Cosine Wave')
sgtitle('Two Subplots','FontSize',28,'FontName','Times New Roman','Color','r')
输出:
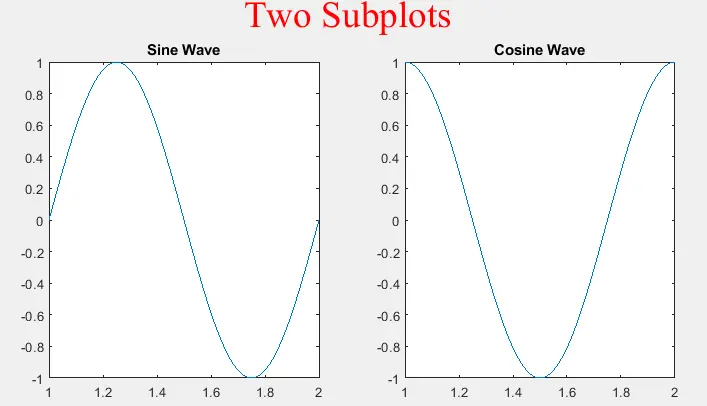
在上图中,可以看到字体大小、字体名称和标题颜色都发生了变化。你可以根据需要更改这些属性。查看此链接以获取有关 sgtitle() 函数的更多详细信息。
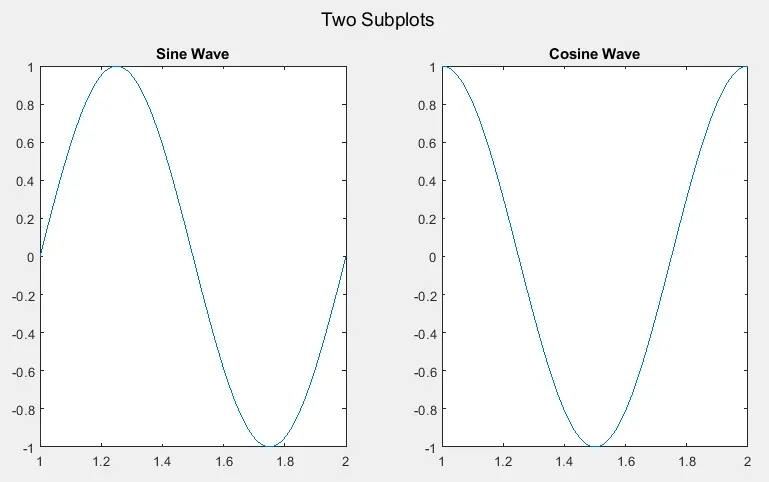
使用 MATLAB 中的 suptitle() 函数为一组子图添加标题
你还可以使用 suptitle() 函数,该函数将给定文本添加到给定图形的所有子图上方。你还可以使用 FontSize 属性更改文本的字体大小,使用 Color 属性更改文本的颜色,以及使用 FontName 属性更改字体的名称。例如,让我们在图形上绘制正弦波和余弦波的两个子图,并在两个子图上方放置一个标题。请参考下面的代码。
t = 1:0.01:2;
x = sin(2*pi*t);
y = cos(2*pi*t);
figure
subplot(1,2,1)
plot(t,x)
title('Sine Wave')
subplot(1,2,2)
plot(t,y)
title('Cosine Wave')
suptitle('Two Subplots')
输出:
现在让我们使用 FontSize 属性将标题的字体大小更改为 18,使用 FontName 属性将字体名称更改为 Calibri,使用 Color 属性将标题颜色更改为绿色。请参考下面的代码。
t = 1:0.01:2;
x = sin(2*pi*t);
y = cos(2*pi*t);
figure
subplot(1,2,1)
plot(t,x)
title('Sine Wave')
subplot(1,2,2)
plot(t,y)
title('Cosine Wave')
t1 = suptitle('Two Subplots')
t1.FontSize = 18;
t1.Color = 'g';
t1.FontName  = 'Calibri'
输出:
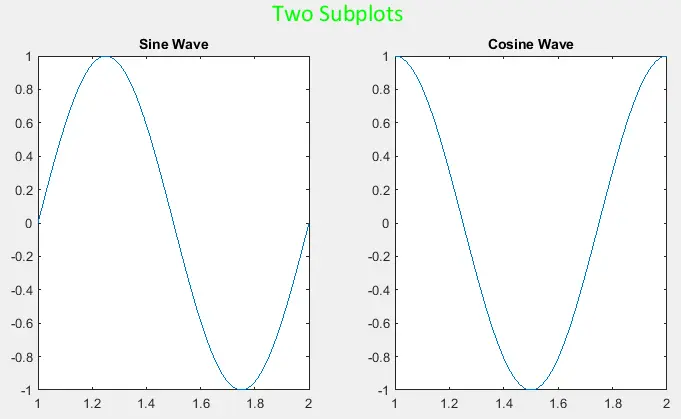
在上图中,可以看到字体大小、字体名称和标题颜色都发生了变化。你可以使用函数句柄 t1 根据你的要求更改这些属性。
