How to Detect and Remove Outliers in Python
- Set Up the Environment and Load the Data Set
- Visualize the Data Set in Python
- Mathematical Methods to Detect the Outliers in Python
- Remove the Outliers From the DataFrame in Python

Within a dataset, an outlier is an item that is abnormally different from the rest of the dataset. However, this definition gives enough room for the data analyst to decide the threshold for abnormality.
We have outliers due to measurement errors, execution errors, sampling problems, incorrect data entry, or even natural variation. Removing outliers is important because their presence can increase errors, introduce bias, and significantly impact statistical models.
In this tutorial, we will be discussing methods for detecting and removing outliers from a dataset. We will demonstrate this by applying our techniques to a well-known Boston Housing dataset, part of the scikit-learn library. This dataset is commonly used in the context of data analysis, and you can learn more about manipulating datasets in Python through our article on How to Remove NaN From List in Python.
The article is structured such that we will explore a method for detecting outliers and then discuss how the technique can be used to remove outliers.
If you wish to follow the tutorial, you can do so within your browser using Google Colab. It’s as simple as opening up a new notebook and writing code.
Here’s a step-by-step guide to getting started with Google Colab.
Set Up the Environment and Load the Data Set
We start by importing a few libraries that we will be using.
import sklearn
from sklearn.datasets import load_boston
import pandas as pd
import matplotlib.pyplot as plt
We can then load the Boston Housing dataset.
bh_dataset = load_boston()
The dataset contains a feature_names attribute, an array containing the names of all the features in the dataset. The data attribute contains all the data.
We will separate the two and then combine them to create a Pandas data frame.
columns = bh_dataset.feature_names
df_boston = pd.DataFrame(bh_dataset.data)
df_boston.columns = columns
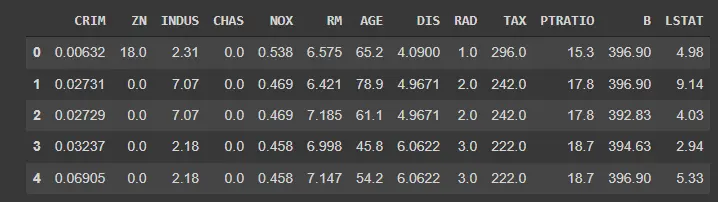
df_boston now contains the entire dataset. Pandas allows us a clean and straightforward way to get a preview of our dataset using the .head() method.
Calling the function as shown below will show a preview of the dataset (also shown below).
df_boston.head()
Output:
Visualize the Data Set in Python
Generate a Box Plot to Visualize the Data Set
A Box Plot, also known as a box-and-whisker plot, is a simple and effective way to visualize your data and is particularly helpful in looking for outliers. In python, we can use the seaborn library to generate a Box plot of our dataset. For further techniques in data smoothing, refer to our article on How to Smooth Data in Python.
import seaborn as sns

sns.boxplot(df_boston["DIS"])
The plot for the above code:
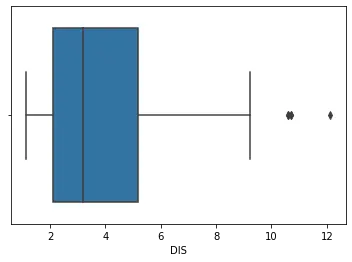
Indexing the dataset with 'DIS' means passing the DIS column into the box plot function. The box plot is generated in 1 dimension.
Hence, it only takes one variable as input. The variable can be changed to generate different box plots.
In the plot above, we can see that the values above 10 are outliers. We will now use this as the standard for outliers in this dataset.
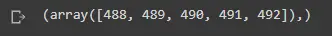
We can select entries in the dataset that fit this criterion using the np.where as shown in the example below.
import numpy as np
DIS_subset = df_boston["DIS"]
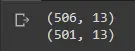
print(np.where(DIS_subset > 10))
Output:

These are array indexes containing data points that are outliers as defined by the above criterion. At the end of the article, we will show you how to use these indices to remove outliers from your dataset.
Generate a Scatter Plot to Visualize the Data Set
Box plots can be used when we have data across a single dimension. However, we can use a scatterplot if we have paired data or the relationship we are analyzing involves two variables.
Python allows us to generate scatterplots using Matplotlib. The following is a code example of printing a scatterplot.
fig, axes = plt.subplots(figsize=(18, 10))
axes.scatter(df_boston["INDUS"], df_boston["TAX"])
axes.set_xlabel("Non-retail business acres per town")
axes.set_ylabel("Tax Rate")
plt.show()
Output:
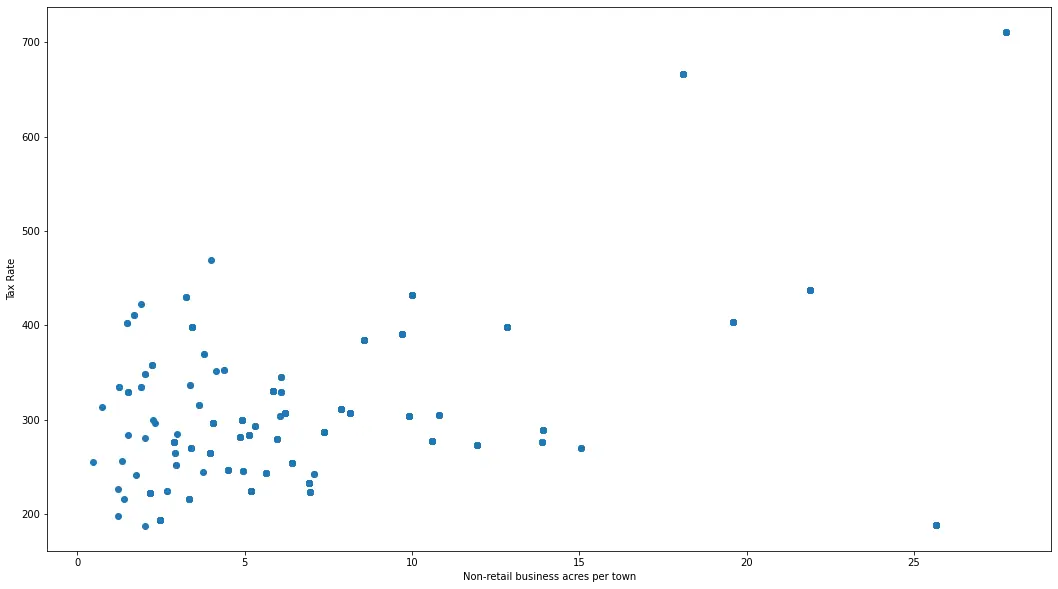
Getting an eye-ball estimate, we can generally say that over the x-axis, values greater than 20 look like outliers, and on the y-axis, values greater than 500 look like outliers. We can use this as our standard for removing outliers.
We will use the same numpy function that we used earlier to detect indices that match this criterion.
print(np.where((df_boston["INDUS"] > 20) & (df_boston["TAX"] > 500)))
Output:
Mathematical Methods to Detect the Outliers in Python
Calculate the Z-Score to Detect the Outliers in Python
The Z-Score (also known as the Standard Score) is a statistic that measures how many standard deviations a data point is from the mean. A larger Z-score shows that the data point is farther away from the mean.
This is important because most data points are near the mean in a normally distributed data set. A data point with a large Z-score is farther away from most data points and is likely an outlier.
We can use Scipy’s utility to generate the Z-score. Once again, we will be selecting a specific column of our dataset to apply the method.
from scipy import stats

z = stats.zscore(df_boston["DIS"])
z_abs = np.abs(z)
The first line in the above code is just importing the library. The second line uses the scipy.zscore method to calculate the Z-score for each data point in the selected dataset.
The third line has a numpy function to convert all the values to positive values. This helps us apply a simple filter.
Printing the array will show us something like this:
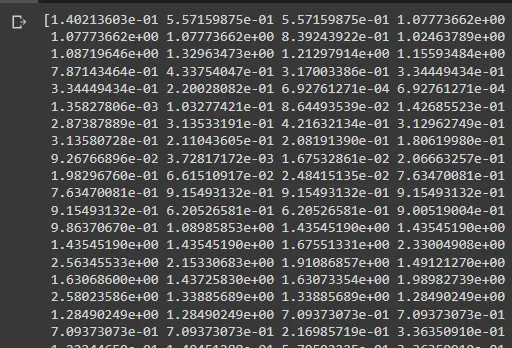
This image does not include all the points, but you may display it by printing z_abs.
We now have to decide the criteria for what points count as outliers. When working with normal distributions, data points three standard deviations above the mean are considered outliers.
This is because 99.7% of the points are within 3 standard deviations of the mean in a normal distribution. This means that all points with a Z-score greater than 3 should be removed.
Once again, we will use the np.where function to find our outlier indices. Learn more about the np.where function.
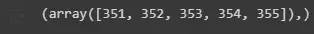
print(np.where(z_abs > 3))
Output:
Calculate the Inter-Quartile Range to Detect the Outliers in Python
This is the final method that we will discuss. This method is very commonly used in research for cleaning up data by removing outliers.
The Inter-Quartile Range (IQR) is the difference between the data’s third quartile and first quartile. We define Q1 as the first quartile, which means that 25% of the data lies between the minimum and Q1.
We define Q3 as the third quartile of the data, meaning that 75% of the data lies between the dataset minimum and Q3.
With these definitions, we can define our upper and lower bounds. Any data point below the lower bound and above the upper bound will be considered an outlier.
Lower bound = Q1 - (1.5 * IQR)
Upper bound = Q3 + (1.5 * IQR)
The 1.5 might look arbitrary, but it has mathematical significance. If you are interested in its detailed math, look at this article
You need to know that this is roughly equivalent to finding data at least 3 standard deviations away from the mean (if our data was normally distributed). In practice, this method is very effective.
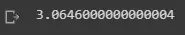
In Python, we can use the NumPy function percentile() to find Q1 and Q3 and then find the IQR.
Q1 = np.percentile(df_boston["DIS"], 25, interpolation="midpoint")
Q3 = np.percentile(df_boston["DIS"], 75, interpolation="midpoint")
IQR = Q3 - Q1
In our dataset, we print the IQR and get the following:
We will now define our upper and lower bounds as follows:
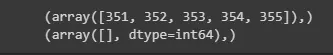
upper_bound = df_boston["DIS"] >= (Q3 + 1.5 * IQR)
lower_bound = df_boston["DIS"] <= (Q1 - 1.5 * IQR)
Once again, we can get the indices for the points which fit the criteria using np.where.
print(np.where(upper_bound))
print(np.where(lower_bound))
Output:
Remove the Outliers From the DataFrame in Python
We will use the dataframe.drop function to drop the outlier points. Click here to more information about the function.
For this, we will have to pass a list containing the indices of the outliers to the function. We can do this as follows:
upper_points = np.where(upper_bound)
df_boston.drop(upper_points[0], inplace=True)
To verify whether or not the points have been dropped, we can print the shape of our data to see the number of entries remaining.
print(df_boston.shape)
df_boston.drop(upper_points[0], inplace=True)
print(df_boston.shape)
Output:
Congratulations! This confirms that we have successfully removed our outliers. You can pass any list of indices using the methods we employed above and pass them to the drop function.

Husnain is a professional Software Engineer and a researcher who loves to learn, build, write, and teach. Having worked various jobs in the IT industry, he especially enjoys finding ways to express complex ideas in simple ways through his content. In his free time, Husnain unwinds by thinking about tech fiction to solve problems around him.
LinkedIn