How to Specify the Legend Position in Graph Coordinates in Matplotlib
We can specify a legend’s position in a graph by setting the loc parameter’s value.
Examples: Specify Legend Position in Graph Coordinates Matplotlib
import matplotlib.pyplot as plt

x = [1, 2, 3]
y1 = [0.5 * i + 1 for i in x]
y2 = [2 * i + 1 for i in x]

fig, ax = plt.subplots(2, 1)

ax[0].plot(x, y1, "b-", label="0.5x+1")
ax[0].plot(x, y2, "g-", label="2x+1")
ax[0].legend(loc="best")

ax[1].plot(x, y1, "b-", label="0.5x+1")
ax[1].plot(x, y2, "g-", label="2x+1")
ax[1].legend(loc="lower left")

plt.tight_layout()
plt.show()
Output:
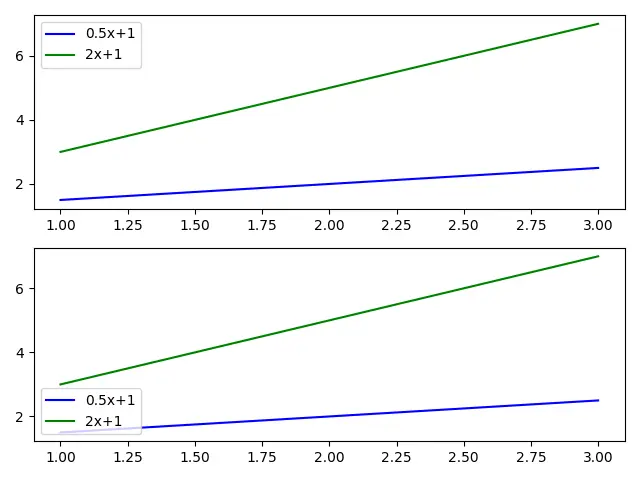
Here, we have a figure with two subplots. The topmost subplot has loc set to best; this places the legend in the figure’s best position, where we do not have any content.
A similar thing happens in the second subplot at the bottom: the legend is placed at the lower left position of the bounding box, covering the entire axes. The bounding box is specified by the bbox_to_anchor parameter, whose default value is (0,0,1,1).
The loc parameter can take any one of the following values:
best |
upper right |
upper left |
lower left |
lower right |
right |
center left |
center right |
lower center |
upper center |
center |
These positions represent the legend’s position, with respect to the bounding box specified by the bbox_to_anchor parameter.
Similarly, we can place the legend at any position in the figure by changing the value of the bbox_to_anchor parameter. The bbox_to_anchor parameter takes a tuple, representing the coordinate, where the corner specified by the loc parameter will be placed.
import matplotlib.pyplot as plt

x = [1, 2, 3]
y1 = [0.5 * i + 1 for i in x]
y2 = [2 * i + 1 for i in x]

fig, ax = plt.subplots(2, 1)

ax[0].plot(x, y1, "b-", label="Plot-1")
ax[0].plot(x, y2, "g-", label="Plot-2")
ax[0].legend(loc="upper left", bbox_to_anchor=(0.9, 0.75))
ax[0].scatter((0.9), (0.75), s=70, c="red", transform=ax[0].transAxes)

ax[1].plot(x, y1, "b-", label="Plot-1")
ax[1].plot(x, y2, "g-", label="Plot-2")
ax[1].legend(loc="center right", bbox_to_anchor=(0.6, 0.4))
ax[1].scatter((0.6), (0.4), s=70, c="red", transform=ax[1].transAxes)

plt.tight_layout()
plt.show()
Output:
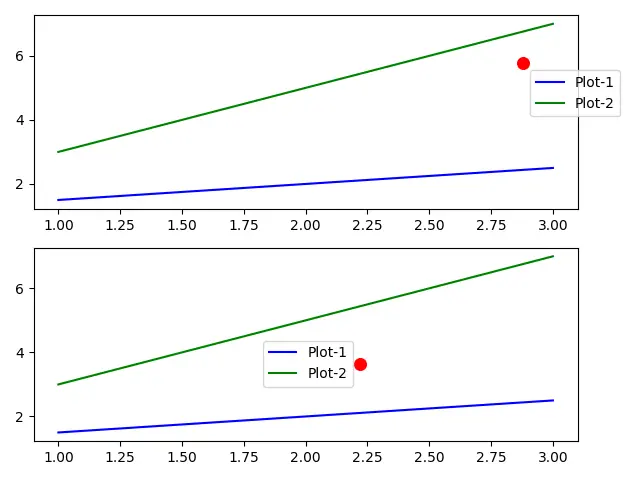
In the subplot at the top, we have set the bbox_to_anchor to (0.9,0.75), which is marked by the red dot on the subplot. The value of the loc parameter "upper left" represents the upper left corner of the legend, which is placed at the red dot.
The subplot at the bottom, the bbox_to_anchor is set to (0.6,0.4) marked by the red dot on the figure’s bottom axes. The value of loc is set to "center right"; hence, the bottom axes’ legend has its center right corner at the red dot.

Suraj Joshi is a backend software engineer at Matrice.ai.
LinkedIn