How to Create a Single Legend for All Subplots in Matplotlib
- Understanding the Basics of Subplots in Matplotlib
-
Method 1: Using a Common Legend with
fig.legend() - Method 2: Customizing Legend Placement
- Method 3: Creating a Legend from Multiple Handles
- Conclusion
- FAQ

Creating visualizations with Matplotlib can be a rewarding experience, especially when you want to convey complex data through subplots. However, one challenge that often arises is managing legends across multiple subplots. While the Matplotlib figure class has a legend method that allows for figure-level legends, it does not provide a straightforward way to create a single legend for all subplots. This can be particularly useful when the patterns and labels of the lines are consistent across the subplots.
In this article, we will explore effective methods to create a unified legend for all your subplots, enhancing both the clarity and aesthetics of your visualizations.
Understanding the Basics of Subplots in Matplotlib
Before diving into the methods for creating a single legend, it’s essential to grasp how subplots work in Matplotlib. Subplots allow you to display multiple plots in a single figure, facilitating a comparative analysis of different datasets. Each subplot can have its own legend, but when you have similar data across various subplots, managing individual legends can lead to clutter and confusion.
To overcome this, we can leverage Matplotlib’s capabilities to create a single legend that encompasses all subplots. This not only streamlines the presentation but also enhances the viewer’s understanding of the data.
Method 1: Using a Common Legend with fig.legend()
One of the simplest methods to create a single legend for all subplots is by using the fig.legend() method. This approach allows you to place a legend at the figure level, which can represent all the lines from the subplots. Here’s how you can implement it:
import matplotlib.pyplot as plt

fig = plt.figure()
axes = fig.subplots(nrows=2, ncols=2)


for ax in fig.axes:
    ax.plot([0, 10], [0, 10], label="linear")

lines, labels = fig.axes[-1].get_legend_handles_labels()

fig.legend(lines, labels, loc="upper center")

plt.show()
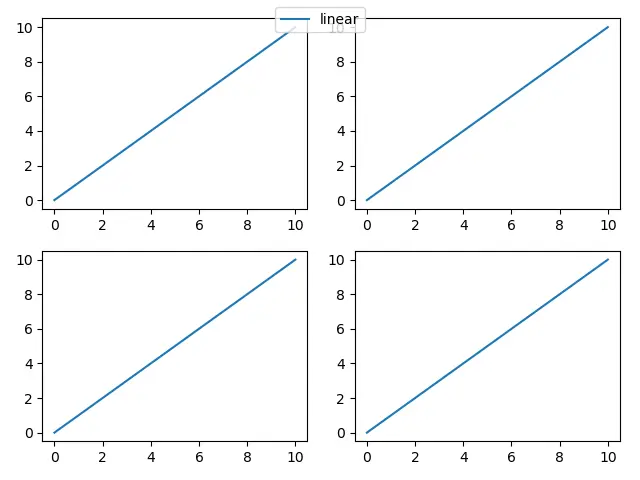
In this examp We plot the sine and cosine functions on each subplot, respectively. By calling fig.legend(), we create a single legend that encompasses both plots. The loc parameter specifies the location of the legend. This method is efficient for visualizations where the same labels are used across subplots, making it easier for viewers to interpret the data.
Method 2: Customizing Legend Placement
While the default fig.legend() method is effective, you may want to customize the legend’s placement further for better aesthetics or to avoid overlapping with plot elements. You can achieve this by manually specifying the position of the legend using the bbox_to_anchor parameter. Here’s a refined approach:
fig, (ax1, ax2) = plt.subplots(1, 2)

ax1.plot(x, y1, label='Sine Wave')
ax2.plot(x, y2, label='Cosine Wave')

fig.legend(loc='upper right', bbox_to_anchor=(1, 1), bbox_transform=fig.transFigure)

plt.show()
Output:
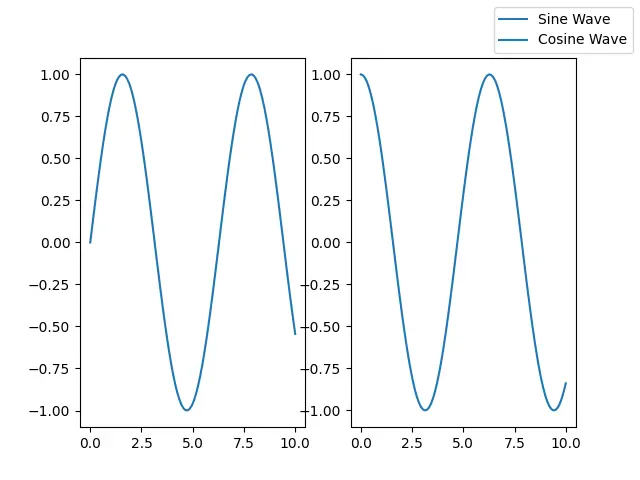
In this code snippet, we utilize bbox_to_anchor to position the legend outside the figure. The bbox_transform parameter is set to fig.transFigure, which allows for precise placement relative to the figure dimensions. This method grants you the flexibility to avoid overlap with your plots, ensuring your legend remains readable and visually appealing. Adjusting the legend’s position can significantly enhance the overall look of your visualization.
Method 3: Creating a Legend from Multiple Handles
Another advanced technique involves creating a legend using handles and labels from each subplot. This method is particularly useful when you have different line styles or colors in each subplot, but you still want a consolidated legend. Here’s how to implement this:
handles, labels = [], []

fig, (ax1, ax2) = plt.subplots(1, 2)

line1, = ax1.plot(x, y1, label='Sine Wave')
line2, = ax2.plot(x, y2, label='Cosine Wave')

handles.extend([line1, line2])
labels.extend(['Sine Wave', 'Cosine Wave'])

fig.legend(handles, labels, loc='upper center', ncol=2)

plt.show()
Output:
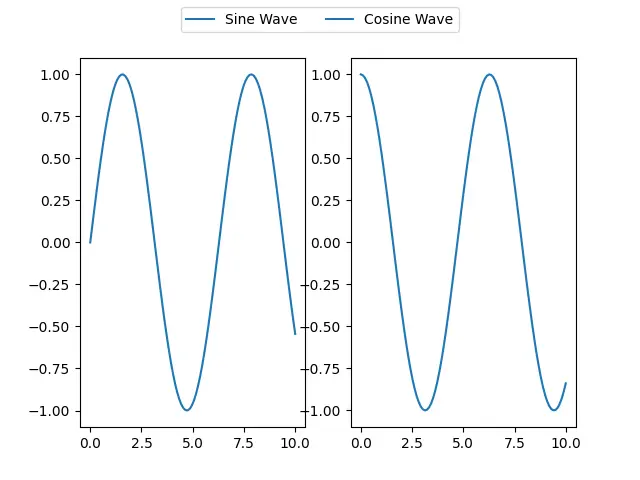
In this method, we first create empty lists for handles and labels. After plotting the lines in each subplot, we append the line objects and their corresponding labels to these lists. Finally, we call fig.legend() with the handles and labels, resulting in a customized legend that accurately represents the data. This approach is particularly beneficial when dealing with complex visualizations involving multiple datasets.
Conclusion
Creating a single legend for all subplots in Matplotlib can significantly enhance the clarity and professionalism of your visualizations. By utilizing methods such as fig.legend(), customizing legend placement, and creating legends from multiple handles, you can effectively manage legends across your subplots. This not only simplifies the viewer’s experience but also elevates the overall quality of your data presentations. With these techniques in your toolkit, you’re well-equipped to create more coherent and visually appealing plots.
FAQ
- How do I create multiple subplots in Matplotlib?
You can create multiple subplots using theplt.subplots()function, specifying the number of rows and columns.
-
Can I customize the legend’s appearance in Matplotlib?
Yes, you can customize the legend’s appearance using parameters likefontsize,frameon, andfacecolor. -
What is the difference between
ax.legend()andfig.legend()?
ax.legend()creates a legend for a specific subplot, whilefig.legend()creates a single legend for the entire figure. -
How can I avoid overlapping legends in my plots?
You can adjust the legend’s position using thelocandbbox_to_anchorparameters to prevent overlapping with plot elements. -
Is it possible to add a legend for only specific lines in a subplot?
Yes, you can specify which lines to include in the legend by passing their handles to thelegend()method.

Founder of DelftStack.com. Jinku has worked in the robotics and automotive industries for over 8 years. He sharpened his coding skills when he needed to do the automatic testing, data collection from remote servers and report creation from the endurance test. He is from an electrical/electronics engineering background but has expanded his interest to embedded electronics, embedded programming and front-/back-end programming.
LinkedIn Facebook