Matplotlib 中如何為所有子圖建立一個圖例
Jinku Hu
2024年2月15日
Matplotlib
Matplotlib Legend

Matplotlib figure 類中的 legend 方法,用於將 legend 放置在圖形級別而不是 subplot 級別。如果所有子圖中線條的圖案和標籤都相同,則用起來會特別方便。
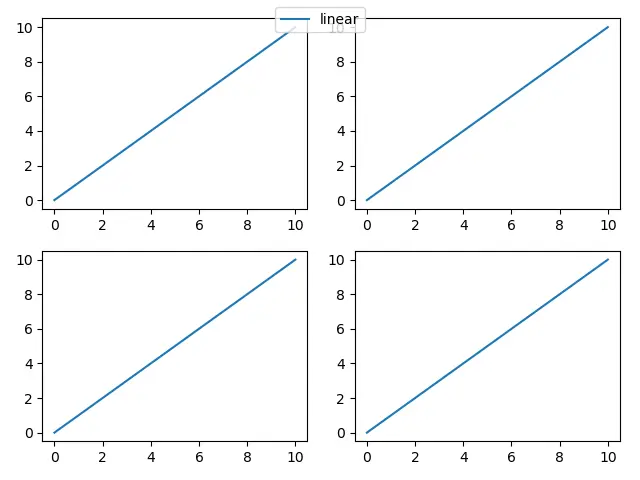
在 Matplotlib 中使用 figure.legend 方法為所有子圖製作單個圖例
import matplotlib.pyplot as plt

fig = plt.figure()
axes = fig.subplots(nrows=2, ncols=2)

for ax in fig.axes:
    ax.plot([0, 10], [0, 10], label="linear")

lines, labels = fig.axes[-1].get_legend_handles_labels()

fig.legend(lines, labels, loc="upper center")

plt.show()
lines, labels = fig.axes[-1].get_legend_handles_labels()
因為我們假定所有子圖具有相同的線條和標籤,因此,最後一個 Axes 的控制代碼和標籤可以用於整個圖形。
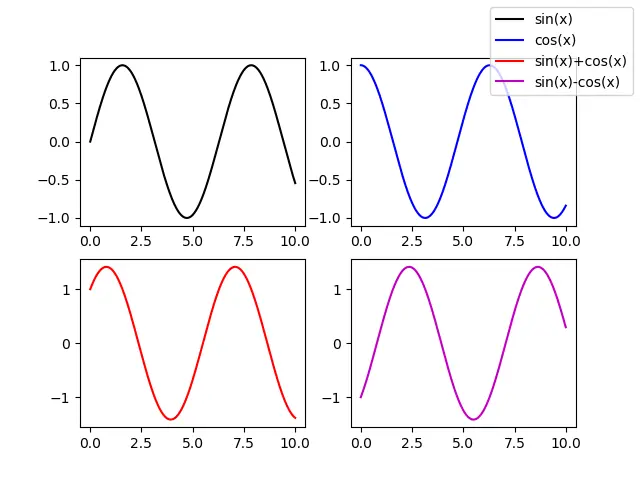
當 Matplotlib 中的線柄和線不同時,使用 figure.legend 方法為所有子圖製作單個圖例
如果子圖之間的線型和標籤不同,但是所有子圖都需要一個圖例,則需要從所有子圖中獲取所有的線柄和標籤。
import matplotlib.pyplot as plt
import numpy as np

x = np.linspace(0, 10, 501)

fig = plt.figure()
axes = fig.subplots(nrows=2, ncols=2)

axes[0, 0].plot(x, np.sin(x), color="k", label="sin(x)")
axes[0, 1].plot(x, np.cos(x), color="b", label="cos(x)")
axes[1, 0].plot(x, np.sin(x) + np.cos(x), color="r", label="sin(x)+cos(x)")
axes[1, 1].plot(x, np.sin(x) - np.cos(x), color="m", label="sin(x)-cos(x)")

lines = []
labels = []

for ax in fig.axes:
    axLine, axLabel = ax.get_legend_handles_labels()
    lines.extend(axLine)
    labels.extend(axLabel)


fig.legend(lines, labels, loc="upper right")

plt.show()
for ax in fig.axes:
    axLine, axLabel = ax.get_legend_handles_labels()
    lines.extend(axLine)
    labels.extend(axLabel)
萬一單個子圖中存在更多的行和標籤,所有的線條控制代碼和標籤都將通過列表 extend 方法新增到 lines 和 labels 列表中。
Enjoying our tutorials? Subscribe to DelftStack on YouTube to support us in creating more high-quality video guides. Subscribe
作者: Jinku Hu
