Crea una singola legenda per tutte le sottotrame in Matplotlib
-
Crea una singola legenda per tutte le sottotrame con il metodo
figure.legendin Matplotlib -
Crea una singola legenda per tutte le sottotrame con il metodo
figure.legendquando le maniglie e le linee sono diverse in Matplotlib

La classe Matplotlib figure ha un metodo legend per posizionare la legend a livello di figura ma non a livello di subplot. È particolarmente conveniente se il motivo e le etichette delle linee sono gli stessi per tutte le sottotrame.
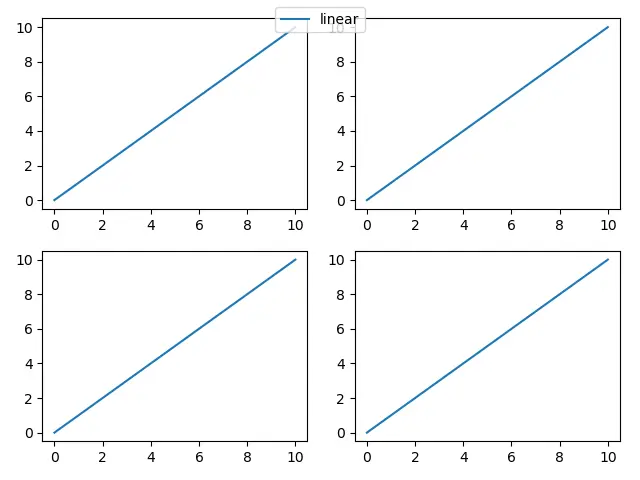
Crea una singola legenda per tutte le sottotrame con il metodo figure.legend in Matplotlib
import matplotlib.pyplot as plt

fig = plt.figure()
axes = fig.subplots(nrows=2, ncols=2)


for ax in fig.axes:
    ax.plot([0, 10], [0, 10], label="linear")

lines, labels = fig.axes[-1].get_legend_handles_labels()

fig.legend(lines, labels, loc="upper center")

plt.show()
lines, labels = fig.axes[-1].get_legend_handles_labels()
Perché abbiamo la presunzione che tutte le sottotrame abbiano le stesse linee ed etichette, quindi, le maniglie e le etichette degli ultimi Assi potrebbero essere utilizzate per l’intera figura.
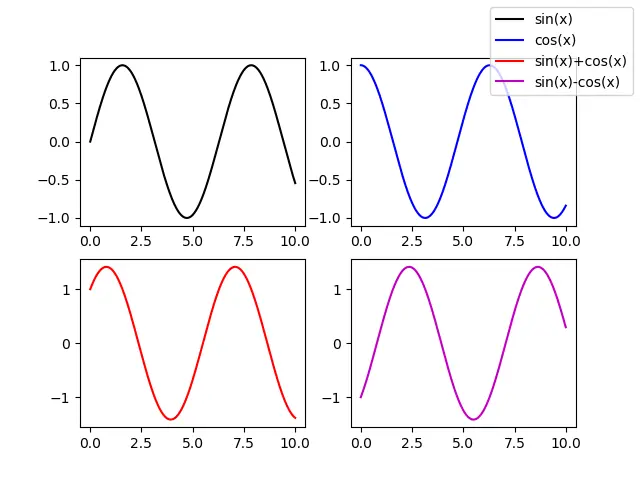
Crea una singola legenda per tutte le sottotrame con il metodo figure.legend quando le maniglie e le linee sono diverse in Matplotlib
Se il modello di linea e le etichette sono diversi tra le sottotrame ma è necessaria un’unica legenda per tutte le sottotrame, è necessario ottenere tutte le maniglie e le etichette di linea da tutte le sottotrame.
import matplotlib.pyplot as plt
import numpy as np

x = np.linspace(0, 10, 501)

fig = plt.figure()
axes = fig.subplots(nrows=2, ncols=2)

axes[0, 0].plot(x, np.sin(x), color="k", label="sin(x)")
axes[0, 1].plot(x, np.cos(x), color="b", label="cos(x)")
axes[1, 0].plot(x, np.sin(x) + np.cos(x), color="r", label="sin(x)+cos(x)")
axes[1, 1].plot(x, np.sin(x) - np.cos(x), color="m", label="sin(x)-cos(x)")

lines = []
labels = []

for ax in fig.axes:
    axLine, axLabel = ax.get_legend_handles_labels()
    lines.extend(axLine)
    labels.extend(axLabel)


fig.legend(lines, labels, loc="upper right")

plt.show()
for ax in fig.axes:
    axLine, axLabel = ax.get_legend_handles_labels()
    lines.extend(axLine)
    labels.extend(axLabel)
Tutte le maniglie e le etichette delle linee vengono aggiunte alla lista lines e labels con il metodo lista extend nel caso in cui esistano più linee ed etichette in una singola sottotrama.

Founder of DelftStack.com. Jinku has worked in the robotics and automotive industries for over 8 years. He sharpened his coding skills when he needed to do the automatic testing, data collection from remote servers and report creation from the endurance test. He is from an electrical/electronics engineering background but has expanded his interest to embedded electronics, embedded programming and front-/back-end programming.
LinkedIn Facebook