How to Change the Line Width of Lines in Matplotlib Legend
-
set_linewidth()Method to Set the Line Width in Matplotliblegend -
matplotlib.pyplot.setp()Method to Set the Line Width in Matplotliblegend - FAQ

Matplotlib is a powerful plotting library in Python that allows users to create a wide range of visualizations. One of the key components of any plot is the legend, which helps to identify the various elements in your visualization. Sometimes, you may want to customize the appearance of your legend, including the line width of the lines. Adjusting the line width can enhance the clarity and aesthetics of your plots, making them more visually appealing.
In this article, we will explore how to change the line width of lines in the Matplotlib legend using the set_linewidth() and setp() methods. Whether you’re a beginner or an experienced user, you’ll find these techniques easy to implement and beneficial for your data visualization projects.
set_linewidth() Method to Set the Line Width in Matplotlib legend
The linewidth parameter in the plot function can be used to control the width of the plot of a particular object, and the set_linewidth() method can be used to control the width of the lines of the legend in Matplotlib.
import numpy as np
import matplotlib.pyplot as plt

x = np.linspace(-3, 3, 100)
y1 = np.sin(x)
y2 = np.cos(x)

fig, ax = plt.subplots(figsize=(8, 6))

ax.plot(x, y1, c="r", label="sinx", linewidth=3.0)
ax.plot(x, y2, c="g", label="cosx", linewidth=5.0)

leg = plt.legend()

leg.get_lines()[0].set_linewidth(6)
leg.get_lines()[1].set_linewidth(10)

plt.show()
Output:
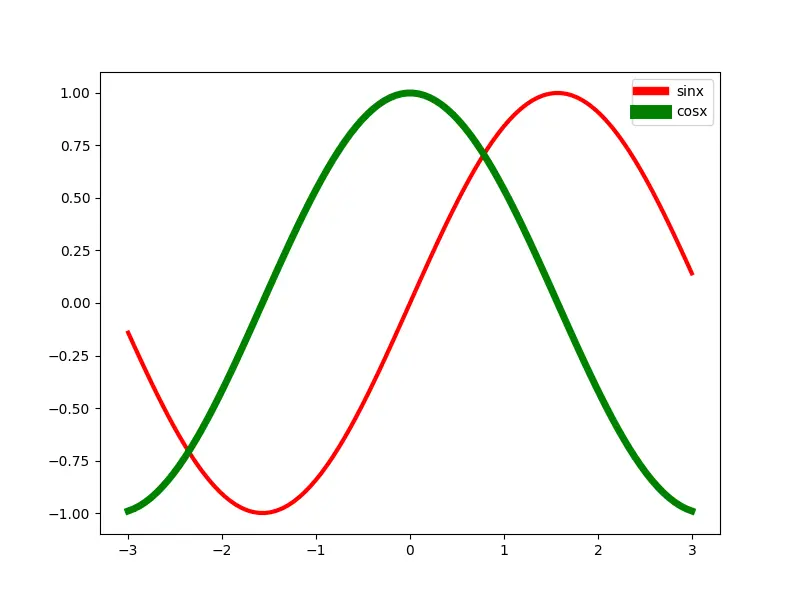
The line widths of two lines in the Python Matplotlib plot are 3.0 and 5.0 respectively, and the line width of lines in the legend by default uses the same line width as in the plot.
leg = plt.legend()

leg.get_lines()[0].set_linewidth(6)
leg is the Python Matplotlib legend object, and leg.get_lines() returns the list of line instances in the legend.
set_linewidth() could change the line width (line thickness) of the legend line to be another value rather than that in the plot.
matplotlib.pyplot.setp() Method to Set the Line Width in Matplotlib legend
matplotlib.pyplot.setp() method allows us to set the property of pyplot objects. We can use the linewidth parameter of setp() function to set linewidth of particular legend object.
import numpy as np
import matplotlib.pyplot as plt
x = np.linspace(-3, 3, 100)
y1 = np.sin(x)
y2 = np.cos(x)
fig, ax = plt.subplots(figsize=(8, 6))
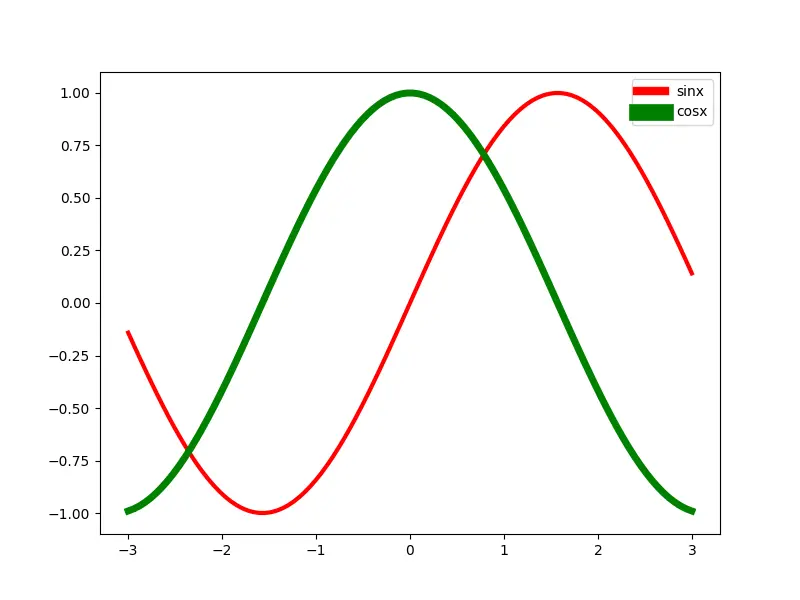
ax.plot(x, y1, c="r", label="sinx", linewidth=3.0)
ax.plot(x, y2, c="g", label="cosx", linewidth=5.0)
leg = plt.legend()
leg_lines = leg.get_lines()
leg_texts = leg.get_texts()
plt.setp(leg_lines[0], linewidth=6)
plt.setp(leg_lines[1], linewidth=12)
plt.setp(leg_texts, fontsize=10)
plt.show()
Output:
FAQ
-
What is Matplotlib?
Matplotlib is a comprehensive library for creating static, animated, and interactive visualizations in Python. -
Why is changing line width in a legend important?
Changing line width enhances the visibility and clarity of the legend, making it easier for viewers to understand the plotted data.
-
Can I change other properties of legend lines?
Yes, you can also change color, linestyle, and marker properties using similar methods. -
Is it possible to customize the legend title as well?
Absolutely! You can use theset_title()method on the legend object to customize the title. -
Are there any performance implications of customizing legends?
Typically, customizing legends has minimal performance impact, but extensive customizations on large datasets may slow down rendering.

Suraj Joshi is a backend software engineer at Matrice.ai.
LinkedIn