How to Place Legend Outside the Plot in Matplotlib

Legend could be placed outside the plot in the Matplotlib by using bbox_to_anchor. bbox means bounding box that accommodates the legend. bbox_to_anchor specifies the legend box’s location.
plt.legend(bbox_to_anchor=(1.05, 1))
It places the legend at location (1.05, 1) in the axes coordinate. (0, 0) is the lower-left corner, and (1.0, 1.0) is the upper right corner of the axes coordinate.
The actual size and location of the legend bounding box are defined with the 4-tuple parameter of bbox_to_anchor and loc in the plt.legend.
plt.legend(bbox_to_anchor=(x0, y0, width, height), loc=)
width and height are the width and the height of the legend box, and (x0, y0) is the coordinate of the loc of the bounding box.
The value of loc could be a number or string that has the relationship as below,
| Loc Number | Loc String |
|---|---|
| 0 | best |
| 1 | upper right |
| 2 | upper left |
| 3 | lower left |
| 4 | lower right |
| 5 | right |
| 6 | center left |
| 7 | center right |
| 8 | lower center |
| 9 | upper center |
| 10 | center |
plt.legend(bbox_to_anchor=(1.05, 1.0, 0.3, 0.2), loc="upper left")
The above code means the legend box is positioned at the axes coordinate (1.05, 1.0) that has the width of 0.3 and the height of 0.2, where (1.05, 1.0) is the coordinate of the upper left corner of the legend bounding box.
bbox_to_anchor Example
import matplotlib.pyplot as plt
import numpy as np

x = np.linspace(0, 10, 100)

plt.plot(x, np.sin(x), label="sin(x)")
plt.plot(x, np.cos(x), label="cos(x)")


plt.legend(bbox_to_anchor=(1.05, 1.0), loc="upper left")
plt.tight_layout()
plt.show()
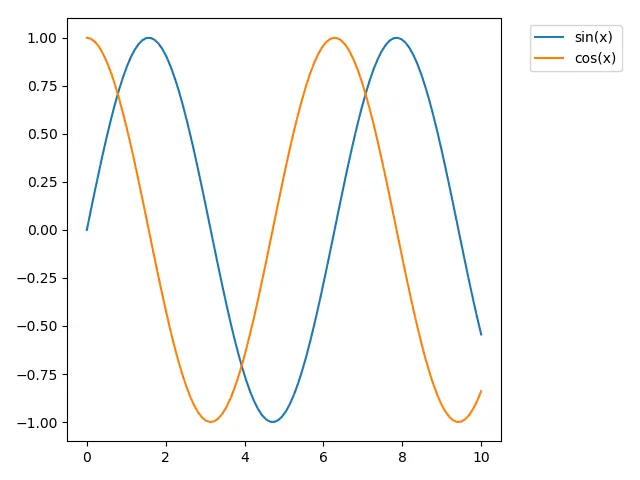
plt.tight_layout() makes subplots nicely fit in the figure.
The legend box would be cropped if tight_layout() is not called.
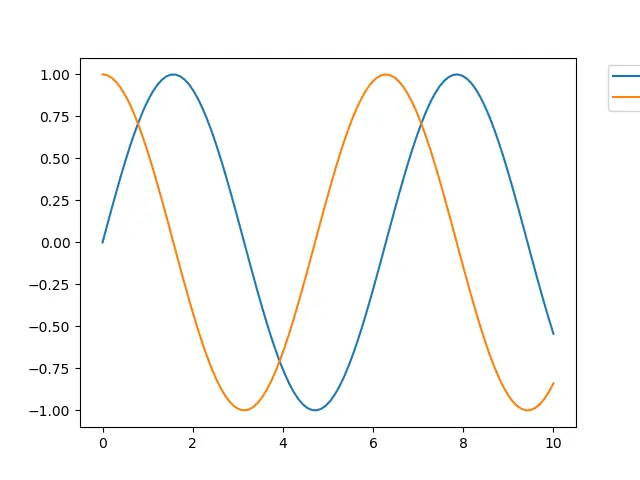
bbox_extra_artists and bbox_inches to Prevent Legend Box From Being Cropped
import matplotlib.pyplot as plt
import numpy as np

x = np.linspace(0, 10, 100)

plt.plot(x, np.sin(x), label="sin(x)")
plt.plot(x, np.cos(x), label="cos(x)")


lg = plt.legend(bbox_to_anchor=(1.05, 1.0), loc="upper left")

plt.savefig(
    "example.png", dpi=300, format="png", bbox_extra_artists=(lg,), bbox_inches="tight"
)
bbox_extra_artists specifies the list of Artist that will be taken into consideration when it calculates the tight bbox.
If the bbox_inches is set to be tight, it will figure out the tight bbox of the figure.

Founder of DelftStack.com. Jinku has worked in the robotics and automotive industries for over 8 years. He sharpened his coding skills when he needed to do the automatic testing, data collection from remote servers and report creation from the endurance test. He is from an electrical/electronics engineering background but has expanded his interest to embedded electronics, embedded programming and front-/back-end programming.
LinkedIn Facebook