How to Remove the Legend in Matplotlib
-
matplotlib.axes.Axes.get_legend().remove() -
matplotlib.axes.Axes.get_legend().set_visible() -
label=nolegendArgument inmatplotlib.axes.Axes.plot()Method -
Set
legend_Attribute ofAxesObject to None
We could use remove() and set_visible() methods of the legend object to remove legend from a figure in Matplotlib. We can also remove legend from a figure in Matplotlib by setting the label to _nolegend_ in plot() method, axes.legend to None and figure.legends to an empty list.
matplotlib.axes.Axes.get_legend().remove()
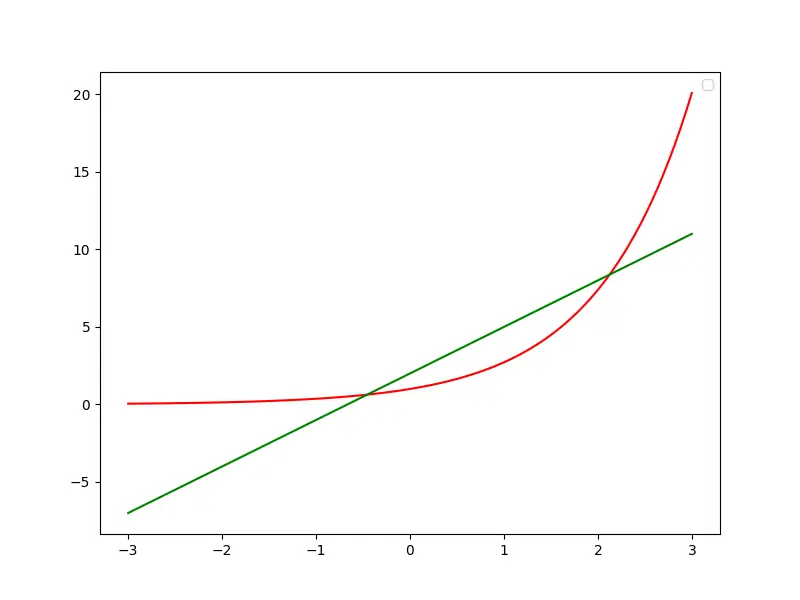
We can remove legend from figure in Matplotlib by using matplotlib.axes.Axes.get_legend().remove() method.
import numpy as np
import matplotlib.pyplot as plt

x = np.linspace(-3, 3, 100)
y1 = np.exp(x)
y2 = 3 * x + 2

fig, ax = plt.subplots(figsize=(8, 6))

ax.plot(x, y1, c="r", label="expoential")
ax.plot(x, y2, c="g", label="Straight line")

leg = plt.legend()

ax.get_legend().remove()

plt.show()
Output:

matplotlib.axes.Axes.get_legend().set_visible()
If we pass False as the argument to matplotlib.axes.Axes.get_legend().set_visible() method, we can remove legend from figure in Matplotlib.
import numpy as np
import matplotlib.pyplot as plt

x = np.linspace(-3, 3, 100)
y1 = np.exp(x)
y2 = 3 * x + 2

fig, ax = plt.subplots(figsize=(8, 6))

ax.plot(x, y1, c="r", label="expoential")
ax.plot(x, y2, c="g", label="Straight line")

leg = plt.legend()

ax.get_legend().set_visible(False)

plt.show()
Output:

This method actually sets the legend invisible but not delete the legend.
label=nolegend Argument in matplotlib.axes.Axes.plot() Method
Passing label=_nolegend_ as an argument in matplotlib.axes.Axes.plot() method also removes legend from figure in Matplotlib.
import numpy as np
import matplotlib.pyplot as plt

x = np.linspace(-3, 3, 100)
y1 = np.exp(x)
y2 = 3 * x + 2

fig, ax = plt.subplots(figsize=(8, 6))
leg = plt.legend()

ax.plot(x, y1, c="r", label="_nolegend_")
ax.plot(x, y2, c="g", label="_nolegend_")

plt.show()
Output:

Set legend_ Attribute of Axes Object to None
Setting legend_ attribute of the Axes object to None removes legend from a figure in Matplotlib.
import numpy as np
import matplotlib.pyplot as plt

x = np.linspace(-3, 3, 100)
y1 = np.exp(x)
y2 = 3 * x + 2

fig, ax = plt.subplots(figsize=(8, 6))
leg = plt.legend()

ax.plot(x, y1, c="r", label="expoential")
ax.plot(x, y2, c="g", label="Straight line")

plt.gca.legend_ = None

plt.show()
Output:

Suraj Joshi is a backend software engineer at Matrice.ai.
LinkedIn