Matplotlib에서 범례를 제거하는 방법
Suraj Joshi
2023년1월30일
Matplotlib
Matplotlib Legend
-
matplotlib.axes.Axes.get_legend().remove() -
matplotlib.axes.Axes.get_legend().set_visible() -
matplotlib.axes.Axes.plot()메소드의label=nolegend인수 -
Axes객체의legend_속성을 None으로 설정
범례 객체의remove()및set_visible()메소드를 사용하여 Matplotlib의 그림에서 범례를 제거 할 수 있습니다. plot()메소드에서label을_nolegend_로axes.legend를None으로,figure.legends를empty list로 설정하여 Matplotlib의 그림에서 범례를 제거 할 수도 있습니다.
matplotlib.axes.Axes.get_legend().remove()
matplotlib에서 matplotlib.axes.Axes.get_legend().remove()메소드를 사용하여 그림에서 범례를 제거 할 수 있습니다.
import numpy as np
import matplotlib.pyplot as plt
x = np.linspace(-3, 3, 100)
y1 = np.exp(x)
y2 = 3 * x + 2
fig, ax = plt.subplots(figsize=(8, 6))
ax.plot(x, y1, c="r", label="expoential")
ax.plot(x, y2, c="g", label="Straight line")
leg = plt.legend()
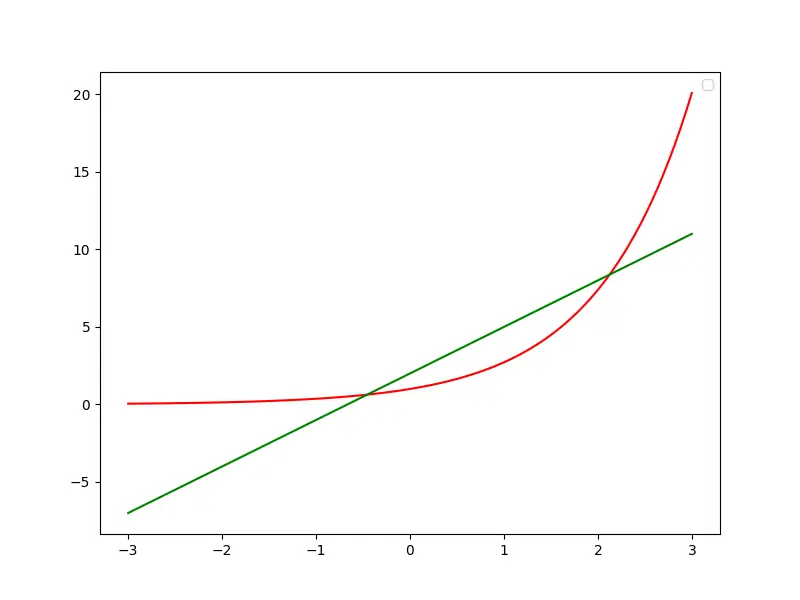
ax.get_legend().remove()
plt.show()
출력:

matplotlib.axes.Axes.get_legend().set_visible()
우리가matplotlib.axes.Axes.get_legend().set_visible()메쏘드에 대한 인수로False를 전달하면 Matplotlib의 그림에서 범례를 제거 할 수 있습니다.
import numpy as np
import matplotlib.pyplot as plt

x = np.linspace(-3, 3, 100)
y1 = np.exp(x)
y2 = 3 * x + 2

fig, ax = plt.subplots(figsize=(8, 6))

ax.plot(x, y1, c="r", label="expoential")
ax.plot(x, y2, c="g", label="Straight line")

leg = plt.legend()

ax.get_legend().set_visible(False)

plt.show()
출력:

이 방법은 실제로 범례를 보이지 않게 설정하지만 범례는 삭제하지 않습니다.
matplotlib.axes.Axes.plot() 메소드의label=nolegend 인수
matplotlib.axes.Axes.plot()메소드의 인수로label=_nolegend_를 전달하면 Matplotlib의 그림에서 범례가 제거됩니다.
import numpy as np
import matplotlib.pyplot as plt

x = np.linspace(-3, 3, 100)
y1 = np.exp(x)
y2 = 3 * x + 2

fig, ax = plt.subplots(figsize=(8, 6))
leg = plt.legend()

ax.plot(x, y1, c="r", label="_nolegend_")
ax.plot(x, y2, c="g", label="_nolegend_")

plt.show()
출력:

Axes 객체의legend_ 속성을 None으로 설정
Axes 객체의legend_ 속성을None으로 설정하면 Matplotlib의 그림에서 범례가 제거됩니다.
import numpy as np
import matplotlib.pyplot as plt

x = np.linspace(-3, 3, 100)
y1 = np.exp(x)
y2 = 3 * x + 2

fig, ax = plt.subplots(figsize=(8, 6))
leg = plt.legend()

ax.plot(x, y1, c="r", label="expoential")
ax.plot(x, y2, c="g", label="Straight line")

plt.gca.legend_ = None

plt.show()
출력:
튜토리얼이 마음에 드시나요? DelftStack을 구독하세요 YouTube에서 저희가 더 많은 고품질 비디오 가이드를 제작할 수 있도록 지원해주세요. 구독하다
작가: Suraj Joshi

Suraj Joshi is a backend software engineer at Matrice.ai.
LinkedIn