How to Change Legend Font Size in Matplotlib
-
rcParamsMethod to Specify the Matplotlib Legend Font Size -
plt.legend(fontsize= )Method to Specify Matplotlib Legend Font Size -
Use the Legend
propProperty to Set the Legend Font Size - Conclusion
- FAQ
We have different methods to set the legend font size in Matplotlib.
rcParams Method to Specify the Matplotlib Legend Font Size
rcParams is a dictionary to handle Matplotlib properties and default styles in Matplotlib.
1. plt.rc('legend', fontsize= ) Method to Specify the Matplotlib Legend Font Size
fontsize could be the integer that has the unit of points, or a size string like
xx - -small
x - small
small
medium
large
x - large
xx - large
plt.rc("legend", fontsize=16)
plt.rc("legend", fontsize="medium")
2. plt.rcparams.update() Method to Specify the Matplotlib Legend Font Size
import matplotlib.pyplot as plt
import numpy as np

x = np.linspace(0, 10, 100)

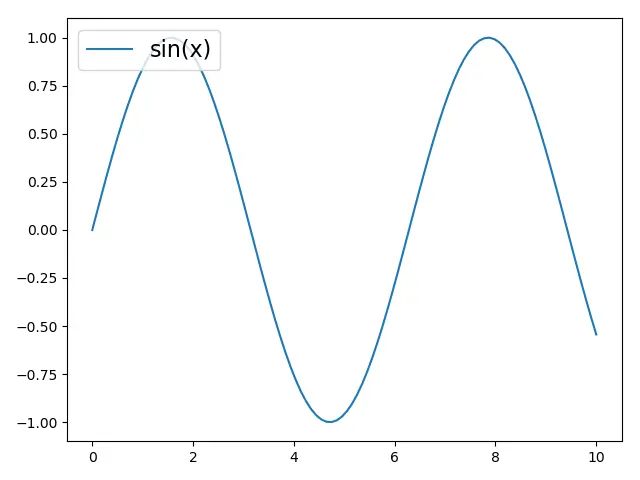
plt.plot(x, np.sin(x), label="sin(x)")

params = {"legend.fontsize": 16, "legend.handlelength": 3}

plt.rcParams.update(params)

plt.legend(loc="upper left")

plt.tight_layout()

plt.show()
legend.fontsize specifies the Matplotlib legend font size, and legend.handlelength specifies the length of the legend handles in font-size units.
plt.rcParams.update(params) updates the Matplotlib properties and styles with the dictionary params as defined above.
You could also update the rcParams dictionary by putting the key in the parentheses [].
plt.rcParams["legend.fontsize"] = 16
plt.rcParams["legend.handlelength"] = 16
plt.legend(fontsize= ) Method to Specify Matplotlib Legend Font Size
plt.legend(fontsize=) could specify the Matplotlib legend font size for each legend when it is created.
import matplotlib.pyplot as plt
import numpy as np

x = np.linspace(0, 10, 100)

plt.plot(x, np.sin(x), label="sin(x)")

plt.legend(fontsize=16, loc="upper right")

plt.show()
Use the Legend prop Property to Set the Legend Font Size
prop property in the legend could set the individual font size of the Matplotlib plot legend. The value of prop is the dictionary of keywords from matplotlib.font_manager.FontProperties.
plt.legend(prop={"size": 16})
Example:
import matplotlib.pyplot as plt
import numpy as np

x = np.linspace(0, 10, 100)

plt.plot(x, np.sin(x), label="sin(x)")

plt.legend(prop={"size": 16}, loc="best")

plt.show()
Conclusion
Customizing the font size of legends in Matplotlib is essential for creating clear and professional-looking plots. Whether you choose to use the fontsize parameter, the set_fontsize method, or adjust the global settings with rcParams, each method offers unique advantages. By mastering these techniques, you can enhance the readability of your visualizations and make your data presentations more effective. Remember, a well-designed plot not only conveys information but also engages your audience. Happy plotting!
FAQ
-
How do I change the font size of the legend in Matplotlib?
You can change the font size using thefontsizeparameter in theplt.legend()function or by using theset_fontsizemethod on the legend object. -
Can I set the font size for all legends at once?
Yes, you can useplt.rcParams['legend.fontsize']to set a global font size for all legends in your plots. -
Is it possible to customize other legend properties in Matplotlib?
Yes, Matplotlib allows you to customize various legend properties, including location, frame, and background color. -
What is the default font size for legends in Matplotlib?
The default font size for legends in Matplotlib is typically set to 10 points, but this can vary depending on your Matplotlib configuration. -
How can I ensure my legends are readable in presentations?
Adjust the font size, use contrasting colors, and consider the overall design of your plot to enhance readability for presentations.

Founder of DelftStack.com. Jinku has worked in the robotics and automotive industries for over 8 years. He sharpened his coding skills when he needed to do the automatic testing, data collection from remote servers and report creation from the endurance test. He is from an electrical/electronics engineering background but has expanded his interest to embedded electronics, embedded programming and front-/back-end programming.
LinkedIn Facebook