如何在 Matplotlib 图例中设置线的线宽
Suraj Joshi
2024年2月15日
Matplotlib
Matplotlib Legend

我们可以通过使用图例对象的 set_linewidth() 方法和 artist 对象的 setp() 方法来更改 Matplotlib 图例中的线宽。
set_linewidth() 方法设置 Matplotlib 图例的线宽
plot 函数中的 linewidth 参数可用于控制特定对象的绘图宽度,set_linewidth() 方法可用于控制 Matplotlib 中图例的线宽。
import numpy as np
import matplotlib.pyplot as plt

x = np.linspace(-3, 3, 100)
y1 = np.sin(x)
y2 = np.cos(x)

fig, ax = plt.subplots(figsize=(8, 6))

ax.plot(x, y1, c="r", label="sinx", linewidth=3.0)
ax.plot(x, y2, c="g", label="cosx", linewidth=5.0)

leg = plt.legend()

leg.get_lines()[0].set_linewidth(6)
leg.get_lines()[1].set_linewidth(10)

plt.show()
输出:
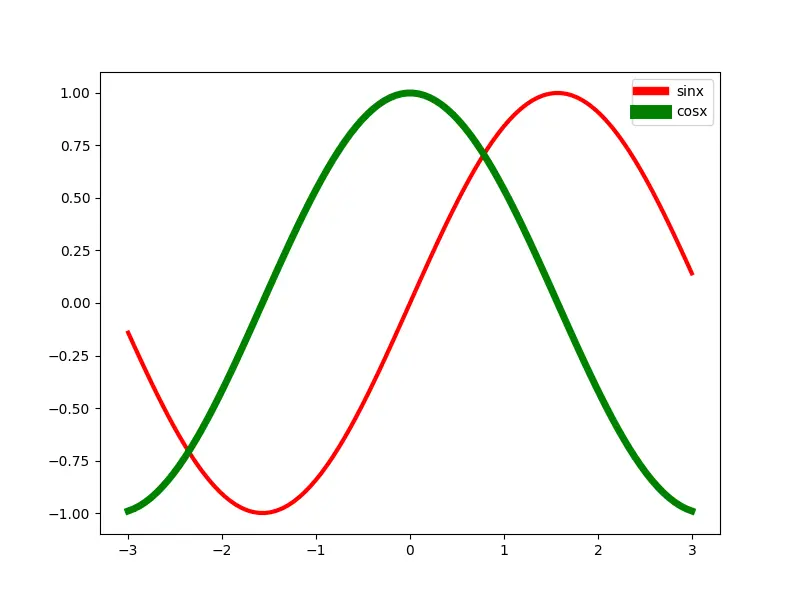
绘图中两条线的线宽分别为 3.0 和 5.0,并且图例中线条的线宽默认使用与绘图中相同的线宽。
leg = plt.legend()

leg.get_lines()[0].set_linewidth(6)
leg 是图例对象,leg.get_lines() 返回图例中的线实例列表。
set_linewidth() 可以将图例线的线宽更改为其他值,而不是图中的值。
matplotlib.pyplot.setp()方法
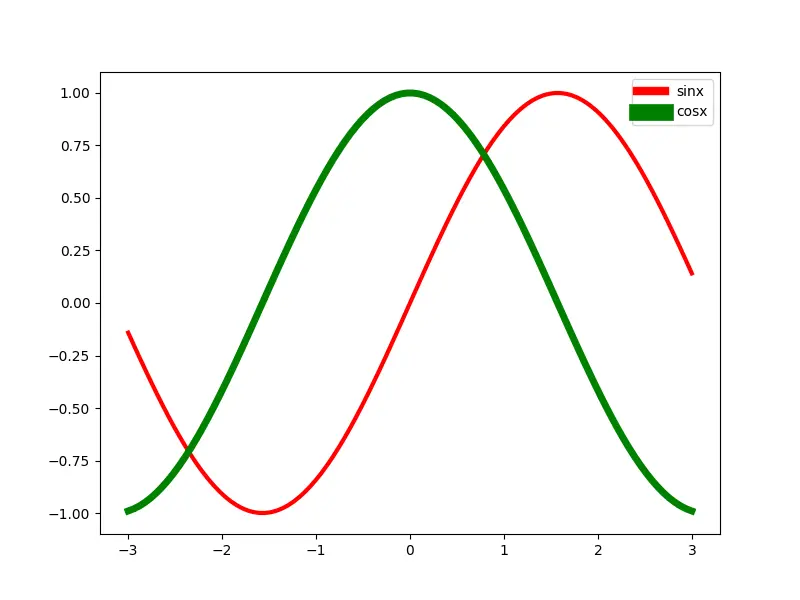
matplotlib.pyplot.setp() 方法允许我们设置 pyplot 对象的属性。我们可以使用 setp() 函数的 linewidth 参数来设置特定图例对象的线宽。
import numpy as np
import matplotlib.pyplot as plt

x = np.linspace(-3, 3, 100)
y1 = np.sin(x)
y2 = np.cos(x)

fig, ax = plt.subplots(figsize=(8, 6))

ax.plot(x, y1, c="r", label="sinx", linewidth=3.0)
ax.plot(x, y2, c="g", label="cosx", linewidth=5.0)

leg = plt.legend()

leg_lines = leg.get_lines()
leg_texts = leg.get_texts()

plt.setp(leg_lines[0], linewidth=6)
plt.setp(leg_lines[1], linewidth=12)
plt.setp(leg_texts, fontsize=10)

plt.show()
输出:
Enjoying our tutorials? Subscribe to DelftStack on YouTube to support us in creating more high-quality video guides. Subscribe
作者: Suraj Joshi

Suraj Joshi is a backend software engineer at Matrice.ai.
LinkedIn