Matplotlib의 그래프 좌표에서 범례 위치를 지정하는 방법
loc 매개 변수의 값을 설정하여 그래프에서 범례의 위치를 지정할 수 있습니다.
예: 그래프 좌표 Matplotlib에서 범례 위치 지정
import matplotlib.pyplot as plt

x = [1, 2, 3]
y1 = [0.5 * i + 1 for i in x]
y2 = [2 * i + 1 for i in x]

fig, ax = plt.subplots(2, 1)

ax[0].plot(x, y1, "b-", label="0.5x+1")
ax[0].plot(x, y2, "g-", label="2x+1")
ax[0].legend(loc="best")

ax[1].plot(x, y1, "b-", label="0.5x+1")
ax[1].plot(x, y2, "g-", label="2x+1")
ax[1].legend(loc="lower left")

plt.tight_layout()
plt.show()
출력:
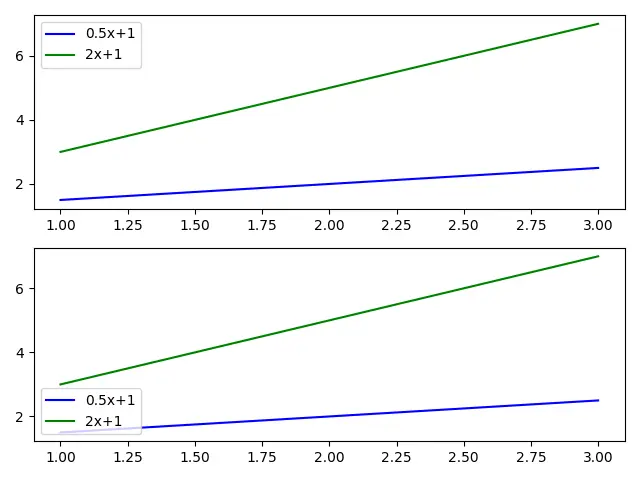
여기에 두 개의 서브 플롯이있는 그림이 있습니다. 최상위 서브 플롯에는loc이best로 설정되어 있습니다. 그러면 범례가 내용이없는 그림의 가장 좋은 위치에 배치됩니다.
아래쪽의 두 번째 서브 플롯에서도 비슷한 일이 발생합니다. 범례는 전체 축을 덮는 경계 상자의 왼쪽 아래위치에 배치됩니다. 경계 상자는 bbox_to_anchor매개 변수로 지정되며 기본값은 (0,0,1,1)입니다.
loc 매개 변수는 다음 값 중 하나를 사용할 수 있습니다.
best |
upper right |
upper left |
lower left |
lower right |
right |
center left |
center right |
lower center |
upper center |
center |
이러한 위치는bbox_to_anchor 매개 변수로 지정된 경계 상자와 관련하여 범례의 위치를 나타냅니다.
마찬가지로bbox_to_anchor 매개 변수의 값을 변경하여 그림의 어느 위치 에나 범례를 배치 할 수 있습니다. bbox_to_anchor매개 변수는 loc매개 변수로 지정된 모서리가 배치되는 좌표를 나타내는 튜플을 사용합니다.
import matplotlib.pyplot as plt

x = [1, 2, 3]
y1 = [0.5 * i + 1 for i in x]
y2 = [2 * i + 1 for i in x]

fig, ax = plt.subplots(2, 1)

ax[0].plot(x, y1, "b-", label="Plot-1")
ax[0].plot(x, y2, "g-", label="Plot-2")
ax[0].legend(loc="upper left", bbox_to_anchor=(0.9, 0.75))
ax[0].scatter((0.9), (0.75), s=70, c="red", transform=ax[0].transAxes)

ax[1].plot(x, y1, "b-", label="Plot-1")
ax[1].plot(x, y2, "g-", label="Plot-2")
ax[1].legend(loc="center right", bbox_to_anchor=(0.6, 0.4))
ax[1].scatter((0.6), (0.4), s=70, c="red", transform=ax[1].transAxes)

plt.tight_layout()
plt.show()
출력:
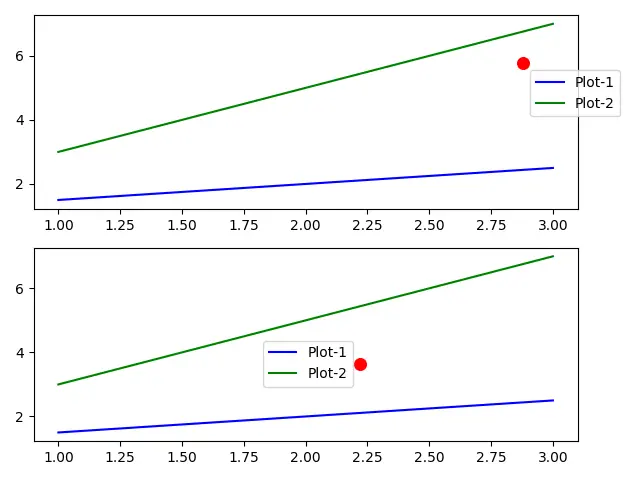
상단의 서브 플롯에서bbox_to_anchor를 서브 플롯에 빨간색 점으로 표시된(0.9,0.75)로 설정했습니다. loc 매개 변수"upper left"의 값은 범례의 왼쪽 상단모서리를 나타내며 빨간색 점에 배치됩니다.
하단의 서브 플롯 인bbox_to_anchor는 Figure의 하단 축에 빨간색 점으로 표시된(0.6,0.4)로 설정됩니다. loc의 값은"center right"로 설정됩니다. 따라서 하단 축의 범례에는 빨간색 점에 중앙 오른쪽모서리가 있습니다.

Suraj Joshi is a backend software engineer at Matrice.ai.
LinkedIn